Top: distribution of $\Delta xy\vert_{y=0}$ for SPD only, before and after alignment Bottom: distribution $\Delta xy\vert_{y=0}$ for track segments reconstructed in the upper and lower parts of SPD+SSD layers;each track segment is required to have four assigned points; SSD survey and Millepede alignment corrections are applied. In both cases,the distributions are produced from the sample of events used to obtain the alignment corrections. |  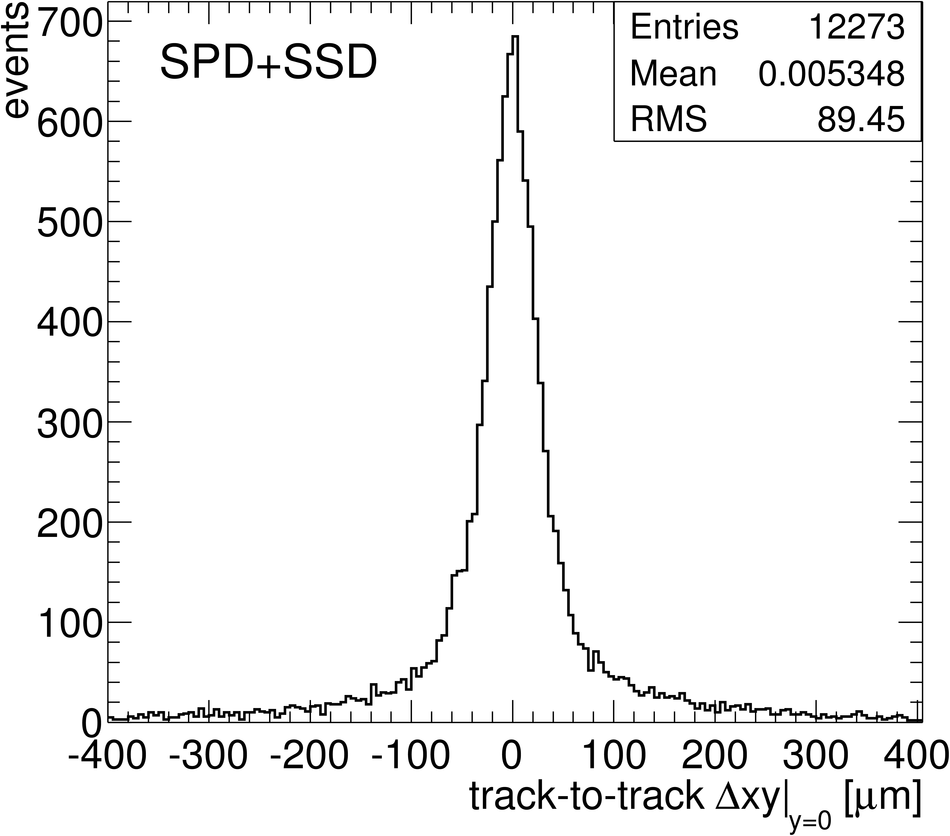 |