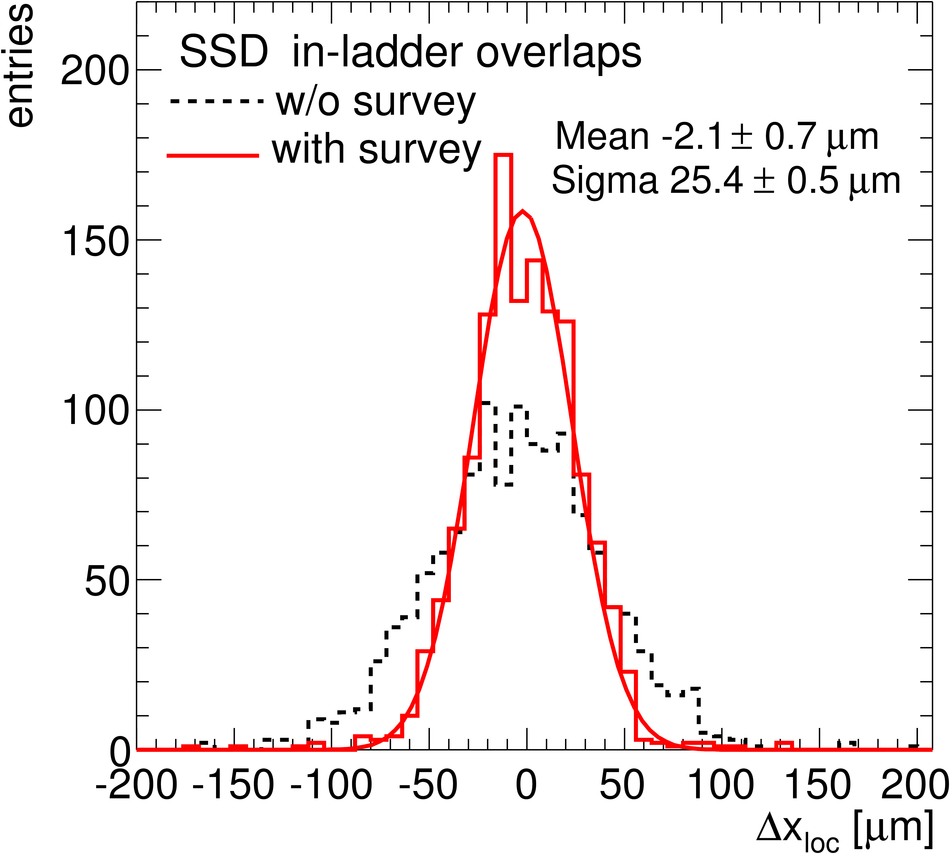
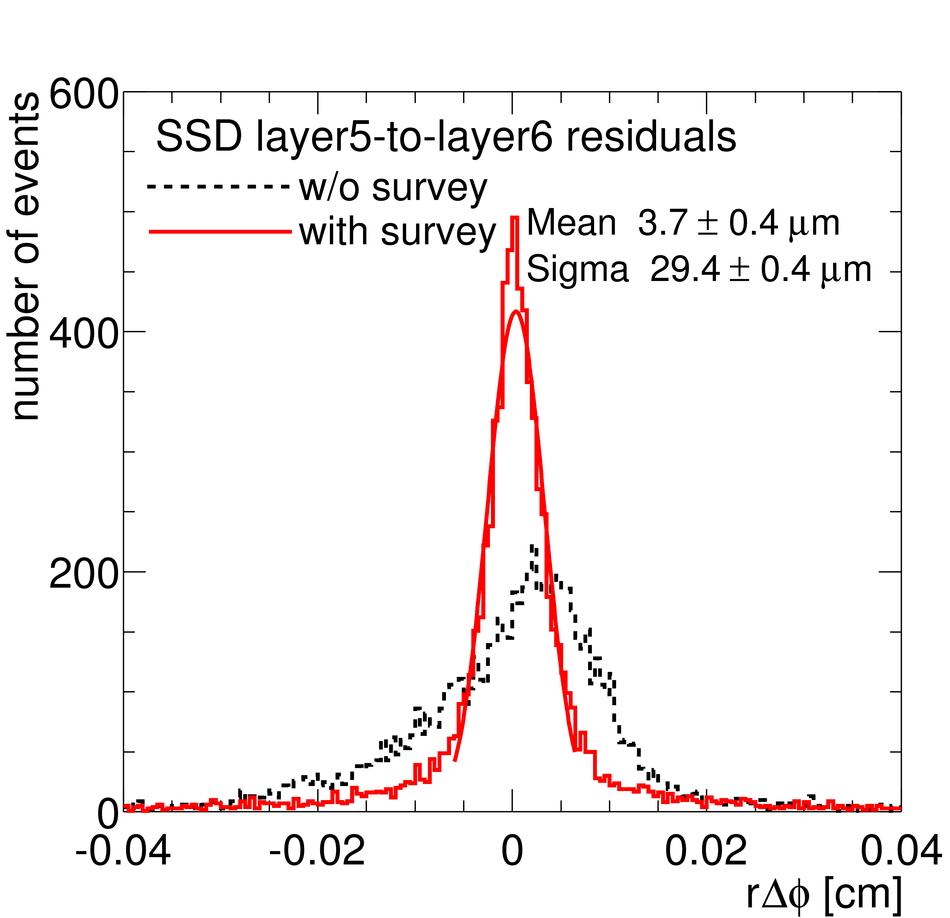
SSD survey validation. Top: distribution of $\Delta x_{\rm loc}$, the distance between two points in the module overlap regions along $z$ on the same ladder Bottom: distribution of the $r\varphi$ residuals between straight-line tracks defined from two points on layer 6 and the corresponding points on layer 5 In both cases, gaussian fits to the distributions with survey applied are shown (in top panel the fit range is $\pm2\,\sigma$, i.e $[-60 \mathrm{\mu m},+60 \mathrm{\mu m}]$). |   |