Online display of the vertex positions reconstructed by the High-Level Trigger (HLT). The figure shows, counter-clockwise from top left, the position in the transverse plane for all events with a reconstructed vertex, the projections along the transverse coordinates $x$ and $y$, and the distribution along the beam line ($z$-axis). | 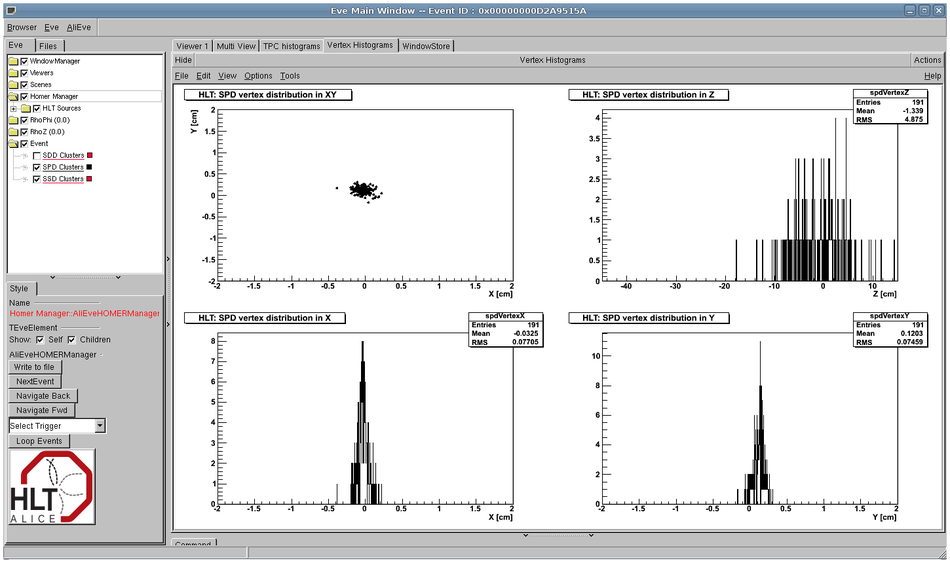 |