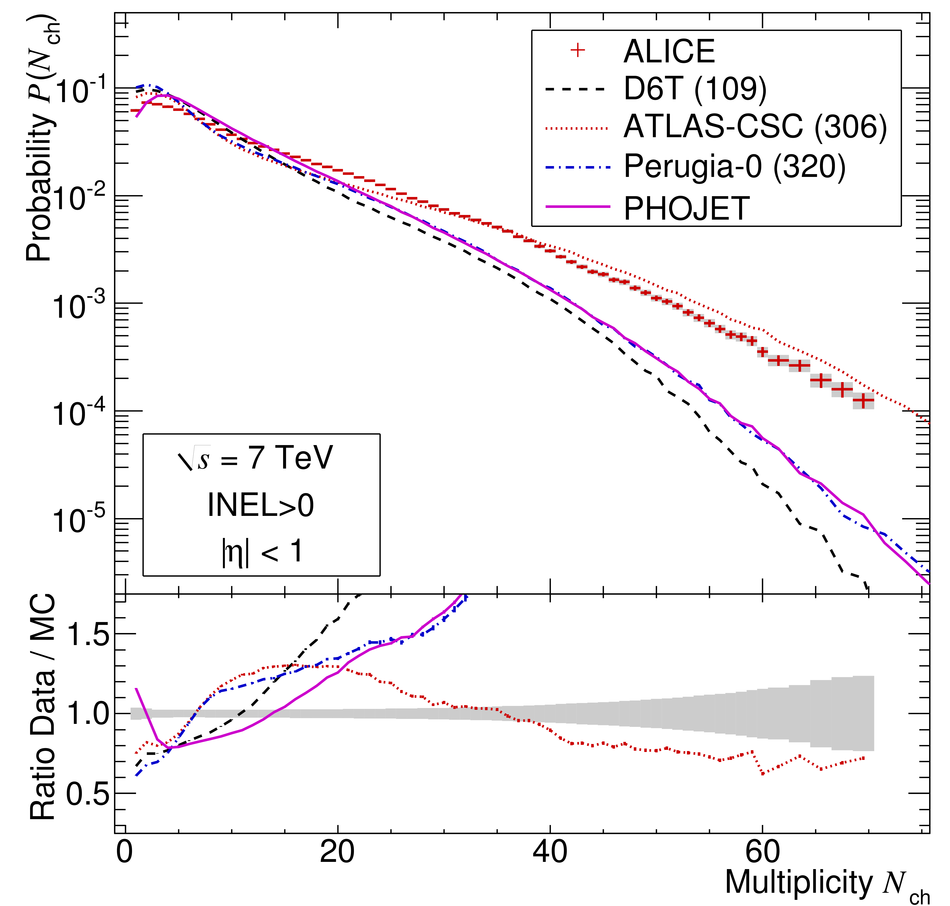
Measured multiplicity distributions in |$\eta$| < 1 for the INEL$>$0$_{|\eta|< 1}$ event class. The error bars for data points represent statistical uncertainties, the shaded areas represent systematic uncertainties. Top: The data at the three energies are shown with the NBD fits (lines). Note that for the 2.36 TeV and 7 TeV data the distributions have been scaled for clarity by the factors indicated. Bottom: The data at 7 TeV are compared to models: PHOJET (solid line), PYTHIA tunes D6T (dashed line), ATLAS-CSC (dotted line) and Perugia-0 (dash-dotted line). In the lower part, the ratios between the measured values and model calculations are shown with the same convention. The shaded area represents the combined statistical and systematic uncertainties. |  |