Distributions of reconstructed event vertices along the beam direction ($z$) obtained from hit correlations in the two pixel layers of the ALICE inner tracking system for the event samples used in the analysis (see text): $\sqrt{s}$ = 0.9 TeV (full symbols) and $\sqrt{s}$ = 2.36] TeV (open symbols). The lines are from Monte Carlo simulations Vertical dashed lines delimit the region $|z|< 10 $cm, where the events for the present analysis were selected. | 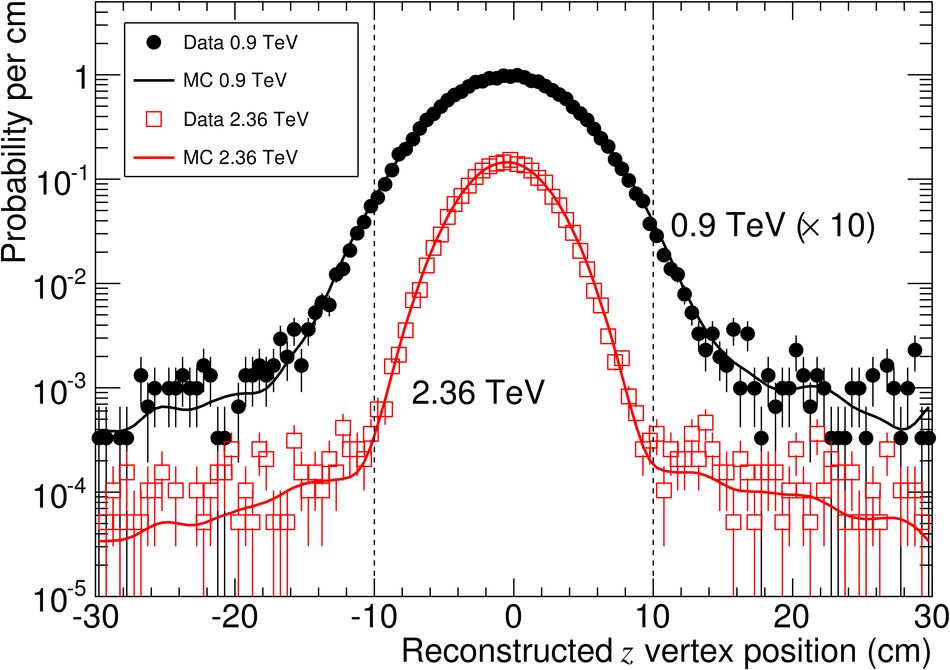 |