Midrapidity antiproton-to-proton ratio in pp collisions at $\sqrt{s} = 0.9$ and $7~$TeV measured by the ALICE experiment

The ratio of the yields of antiprotons to protons in pp collisions has been measured by the ALICE experiment at $\sqrt{s} = 0.9$ and $7~$TeV during the initial running periods of the Large Hadron Collider(LHC). The measurement covers the transverse momentum interval $0.45 <~ p_{\rm{t}} <~ 1.05$~GeV/$c$ and rapidity $|y| <~ 0.5$. The ratio is measured to be $R_{|y| <~ 0.5} = 0.957 \pm 0.006 (stat.) \pm 0.014 (syst.)$ at $0.9$~TeV and $R_{|y| <~ 0.5} = 0.991 \pm 0.005 (stat.) \pm 0.014 (syst.)$ at $7~$TeV and it is independent of both rapidity and transverse momentum. The results are consistent with the conventional model of baryon-number transport and set stringent limits on any additional contributions to baryon-number transfer over very large rapidity intervals in pp collisions.


Phys. Rev. Lett. 105 (2010) 072002
HEP Data
e-Print: arXiv:1006.5432 | PDF | inSPIRE
CERN Record

Figure 1

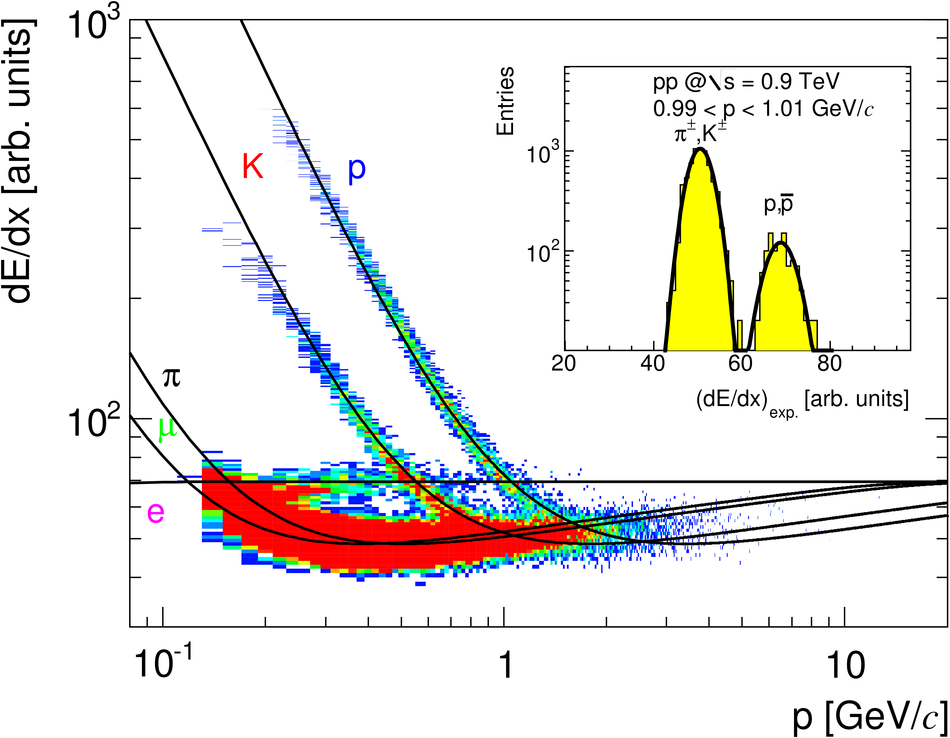
The measured ionization per unit length as a function of particle momentum (both charges) in the TPC gas. The curves correspond to expected energy loss [14] for different particle types. The inset shows the measured ionization for tracks with $0.99 < p < 1.01 $GeV/$c$. The lines are Gaussian fits to the data.

Figure 2

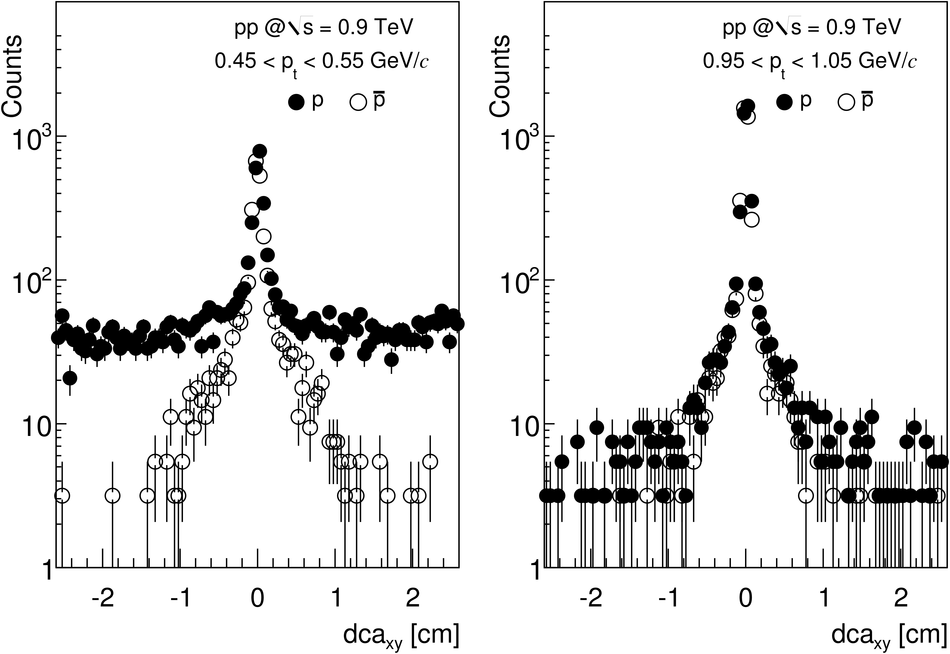
The distance of closest approach ($dca$) distributions of $\rm{p}$and $\overline{\rm{p}}$ for the lowest (left plot) and highest (right plot) transverse momentum bins. The broad background of protons at low momentum originates from secondary particles created in the detector material, whereas the tails for both $\rm{p}$ and $\overline{\rm{p}}$ at high momentum (and for $\overline{\rm{p}}$ at low momentum) arise from weak hyperon decays.

Figure 3

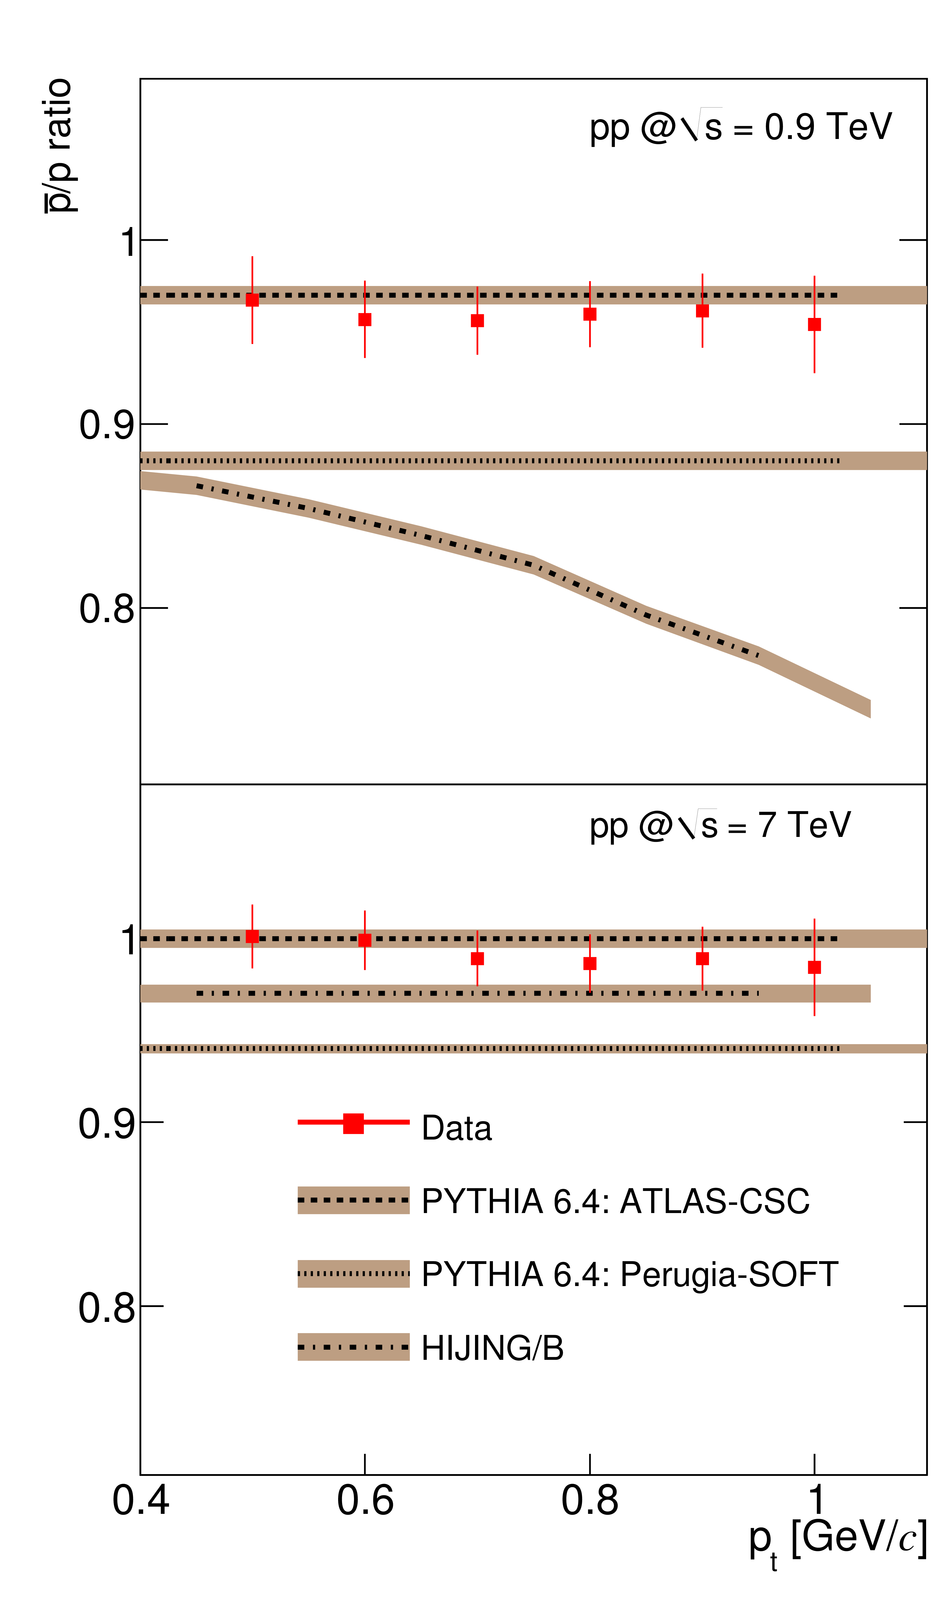
The $\pt$ dependence of the $\bar{\mbox{p}}$/p ratio integrated over $|y| < 0.5$ for pp collisions at $\sqrt{s} = 0.9 $TeV (top) and $\sqrt{s} = 7 $TeV (bottom). Only statistical errors are shown for the data;the width of the Monte Carlo bands indicates the statistical uncertainty of the simulation results.

Figure 4

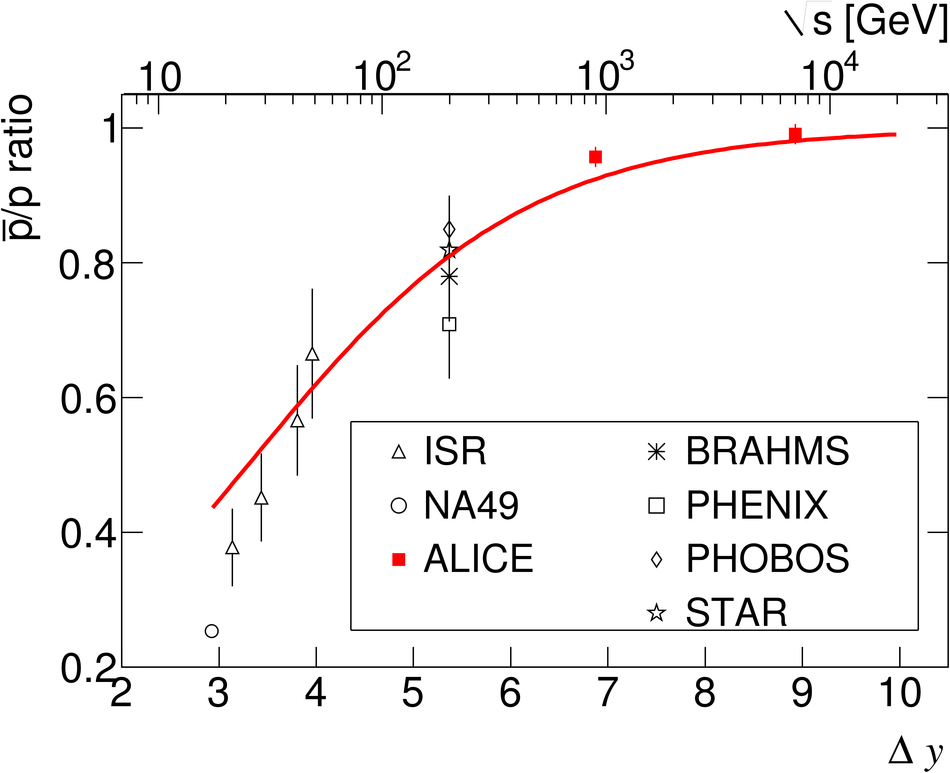
Central rapidity $\bar{\mbox{p}}$/p ratio as a function of the rapidity interval $\Delta y$ (lower axis) and center-of-mass energy (upper axis). Error bars correspond to the quadratic sum of statistical and systematic uncertainties for the RHIC and LHC measurements and to statistical errors otherwise.