In ultrarelativistic heavy-ion collisions, the event-by-event variation of the elliptic flow $v_2$ reflects fluctuations in the shape of the initial state of the system. This allows to select events with the same centrality but different initial geometry. This selection technique, Event Shape Engineering, has been used in the analysis of charge-dependent two- and three-particle correlations in Pb-Pb collisions at $\sqrt{s_{_{\rm NN}}} =2.76$ TeV. The two-particle correlator $\langle \cos(\varphi_\alpha - \varphi_\beta) \rangle$, calculated for different combinations of charges $\alpha$ and $\beta$, is almost independent of $v_2$ (for a given centrality), while the three-particle correlator $\langle \cos(\varphi_\alpha + \varphi_\beta - 2\Psi_2) \rangle$ scales almost linearly both with the event $v_2$ and charged-particle pseudorapidity density. The charge dependence of the three-particle correlator is often interpreted as evidence for the Chiral Magnetic Effect (CME), a parity violating effect of the strong interaction. However, its measured dependence on $v_2$ points to a large non-CME contribution to the correlator. Comparing the results with Monte Carlo calculations including a magnetic field due to the spectators, the upper limit of the CME signal contribution to the three-particle correlator in the 10-50% centrality interval is found to be 26-33% at 95% confidence level.
Phys. Lett. B 777 (2018) 151-162
HEP Data
e-Print: arXiv:1709.04723 | PDF | inSPIRE
CERN-EP-2017-241
Figure 1
Unidentified charged particle $v_2$ for shape selected and unbiased events as a function of collision centrality. The event selection is based on $q_2$ determined in the V0C with the lowest (highest) value corresponding to 0--10\% (90--100\%) $q_2$. Points are slightly shifted along the horizontal axis for better visibility. Error bars (shaded boxes) represent the statistical (systematic) uncertainties. | 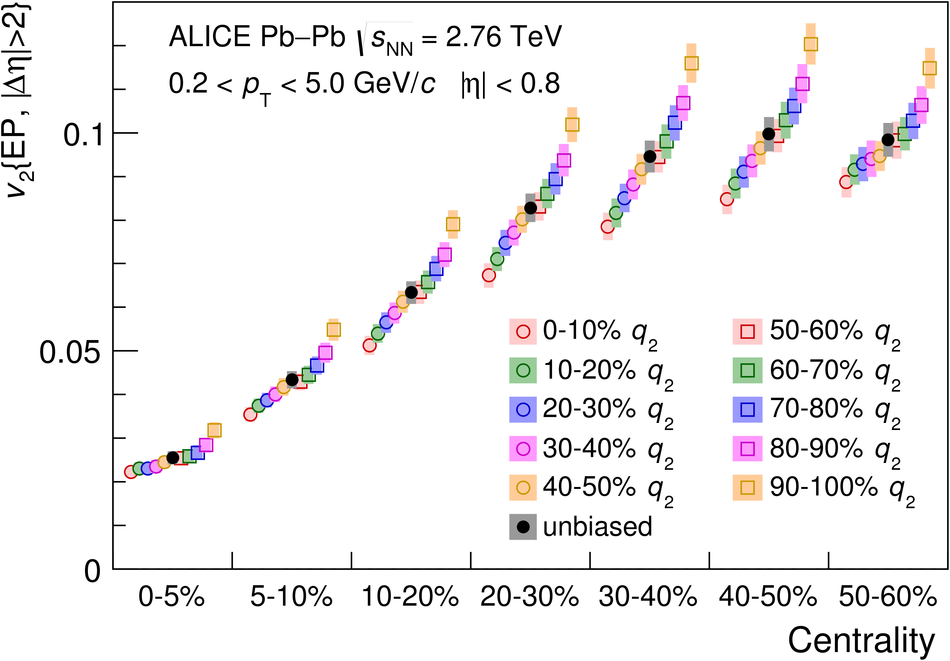 |
Figure 2
Top: Centrality dependence of $\gc$ for pairs of particles with same and opposite charge for shape selected and unbiased events. Bottom: Centrality dependence of $\dc$ for pairs of particles with same and opposite charge for shape selected and unbiased events.The event selection is based on $q_2$ determined in the V0C with the lowest (highest) value corresponding to 0--10\% (90--100\%) $q_2$. Points are slightly shifted along the horizontal axis for better visibility in both panels. Error bars (shaded boxes) represent the statistical (systematic) uncertainties. | 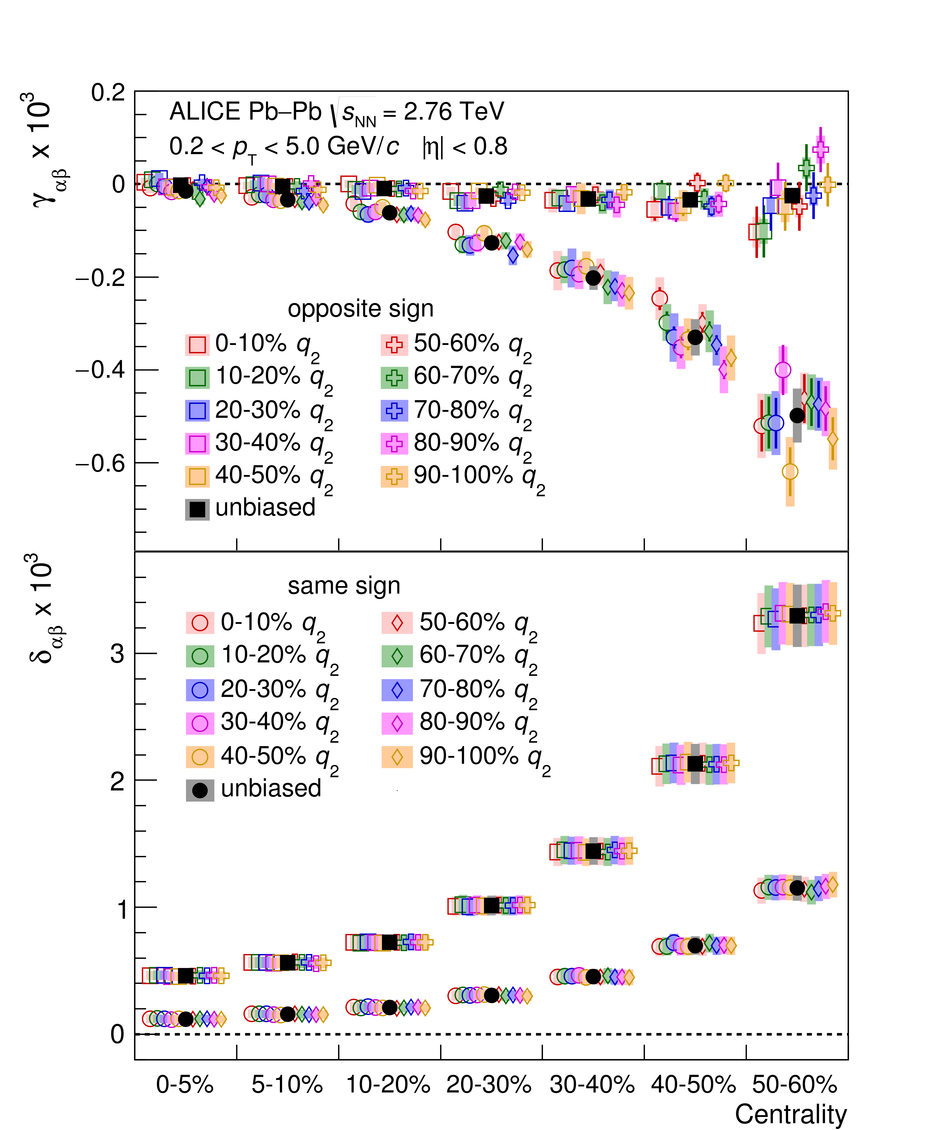 |
Figure 3
Top: Difference between opposite and same charge pair correlations for $\gc$ as a function of $v_2$ for shape selected events together with a linear fit (dashed lines) for various centrality classes. Bottom: Difference between opposite and same charge pair correlations for $\gc$ multiplied by the charged-particle density as a function of $v_2$ for shape selected events for various centrality classes. The event selection is based on $q_2$ determined in the V0C with the lowest (highest) value corresponding to 0--10\% (90--100\%) $q_2$. Error bars (shaded boxes) represent the statistical (systematic) uncertainties. | 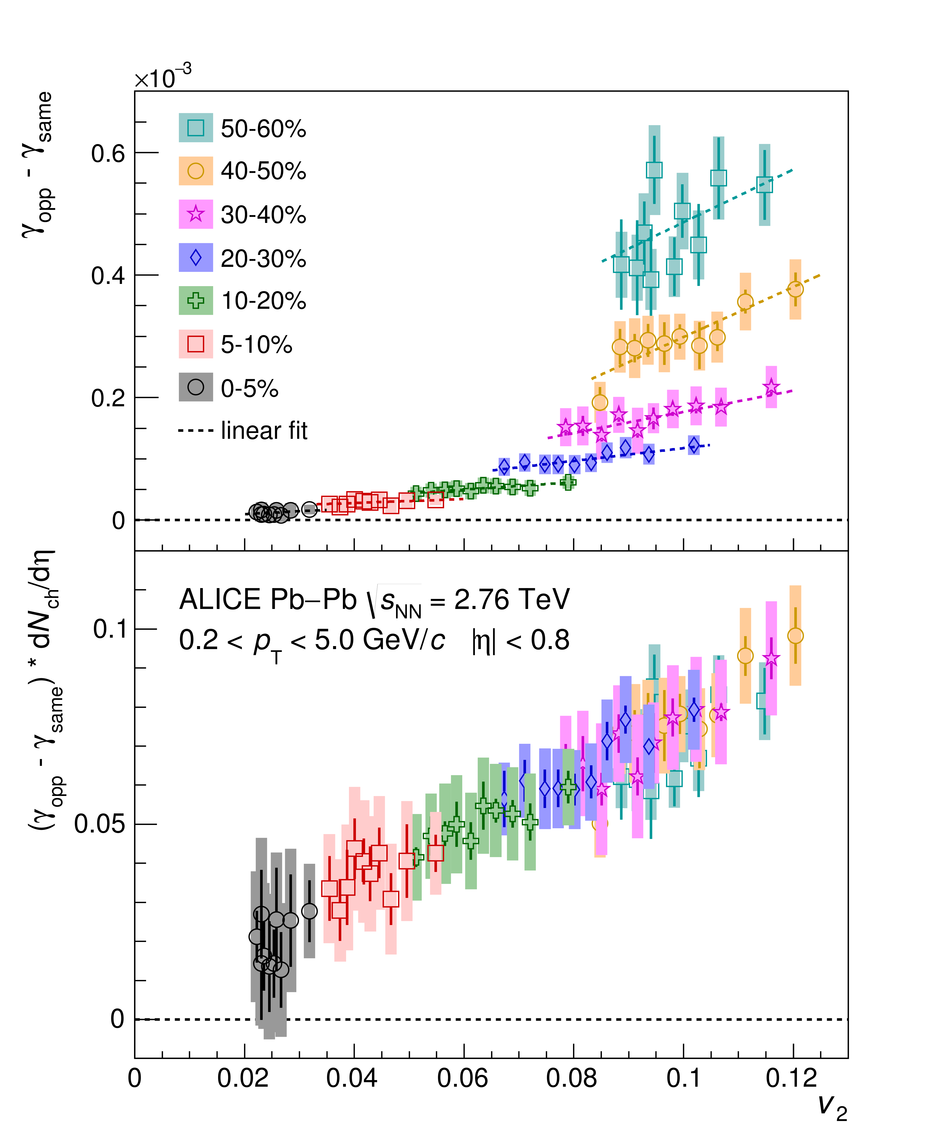 |
Figure 4
The expected dependence of the CME signal on $v_2$ for various centrality classes from a MC-Glauber simulation (see text for details). No event shape selection is performed in the model, and therefore a large range in $v_2$ is covered. The solid lines depict linear fits based on the $v_2$ variation observed within each centrality interval. | 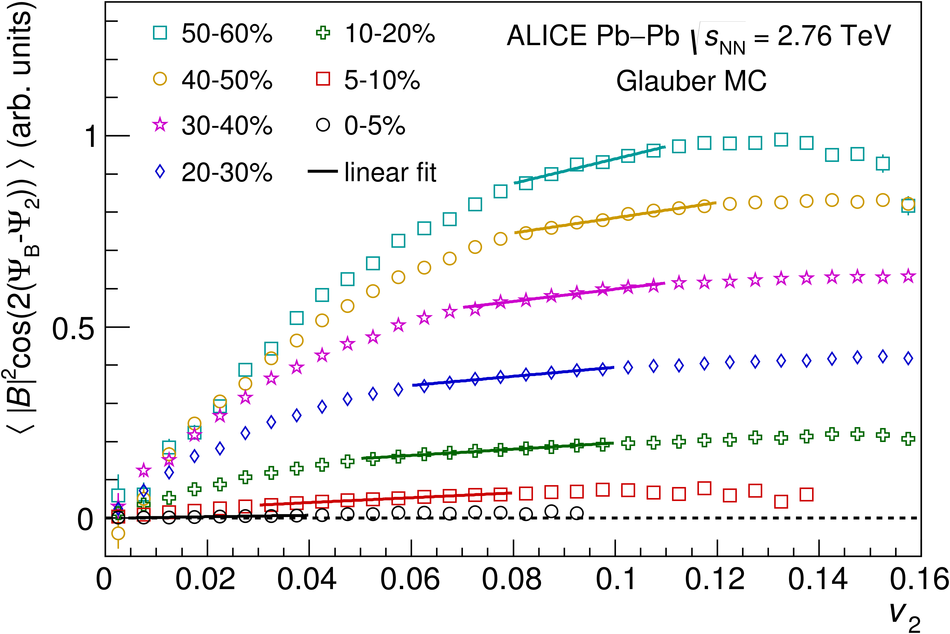 |
Figure 5
Centrality dependence of the $p_{1}$ parameter from a linear fit to the difference between opposite and same charge pair correlations for $\gc$ and from linear fits to the CME signal expectations from MC-Glauber , MC-KLN CGC and EKRT models (see text for details). Points from MC simulations are slightly shifted along the horizontal axis for better visibility. Only statistical uncertainties are shown. | 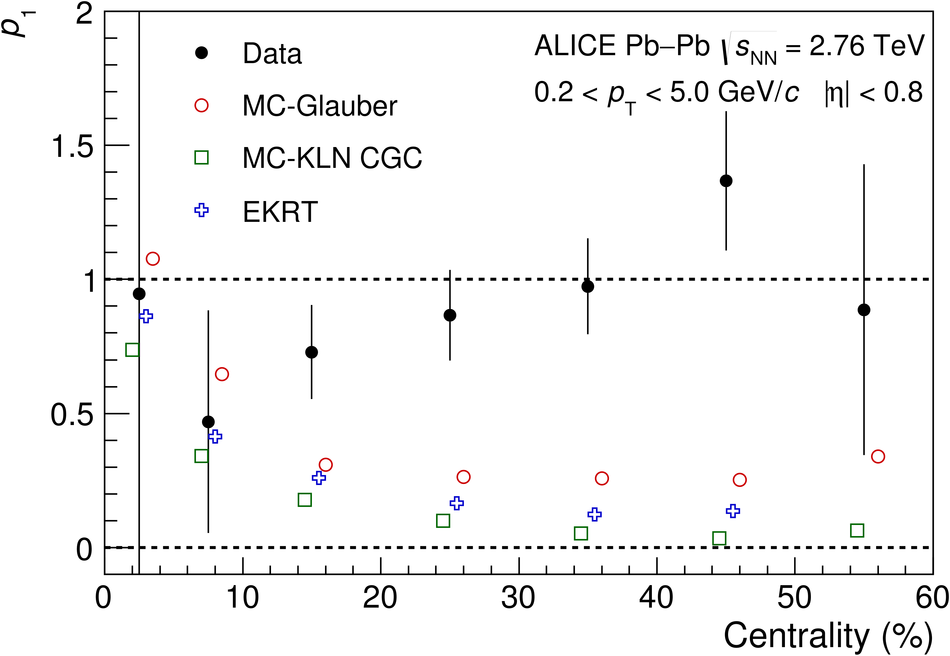 |
Figure 6
Centrality dependence of the CME fraction extracted from the slope parameter of fits to data and MC-Glauber , MC-KLN CGC and EKRT models, respectively (see text for details). The dashed lines indicate the physical parameter space of the CME fraction. Points are slightly shifted along the horizontal axis for better visibility. Only statistical uncertainties are shown. | 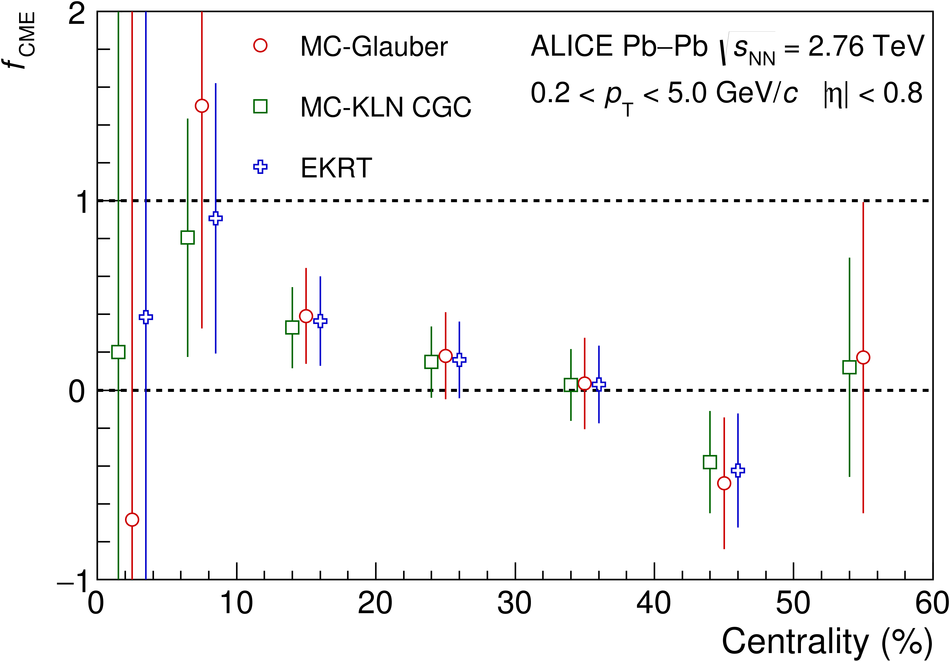 |