We present the charged-particle multiplicity distributions over a wide pseudorapidity range ($-3.4<~\eta<~5.0$) for pp collisions at $\sqrt{s}=$ 0.9, 7, and 8 TeV at the LHC. Results are based on information from the Silicon Pixel Detector and the Forward Multiplicity Detector of ALICE, extending the pseudorapidity coverage of the earlier publications and the high-multiplicity reach. The measurements are compared to results from the CMS experiment and to PYTHIA, PHOJET and EPOS LHC event generators, as well as IP-Glasma calculations.
Eur. Phys. J. C 77 (2017) 852
HEP Data
e-Print: arXiv:1708.01435 | PDF | inSPIRE
CERN-EP-2017-192
Figure 1
Response matrices obtained propagating Monte Carlo generated events, in this case with the PYTHIA ATLAS-CSC flat tune for the non-single-diffractive event class selection. Left: Matrix including the overlap region between SPD and FMD. Right: Matrix for the region where the majority of the counts are from the FMD. The diagonal (generated=reconstructed) is plotted as a black dotted line. | 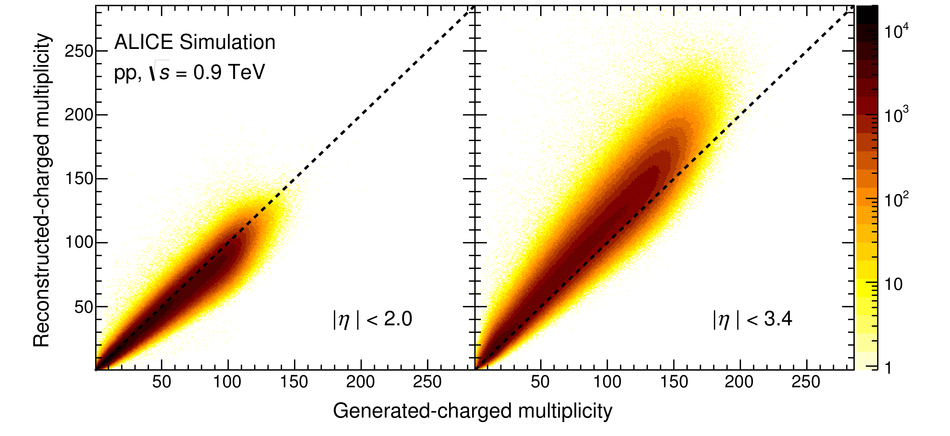 |
Figure 3
Charged-particle multiplicity distributions for NSD (top left), INEL (top right) and INEL$>$0 (bottom) pp collisions at $\sqrt{s}=0.9$ TeV The lines show fits to double NBDs Ratios of the data to the fits are also presented Combined systematic and statistical uncertainties are shown as bands. |  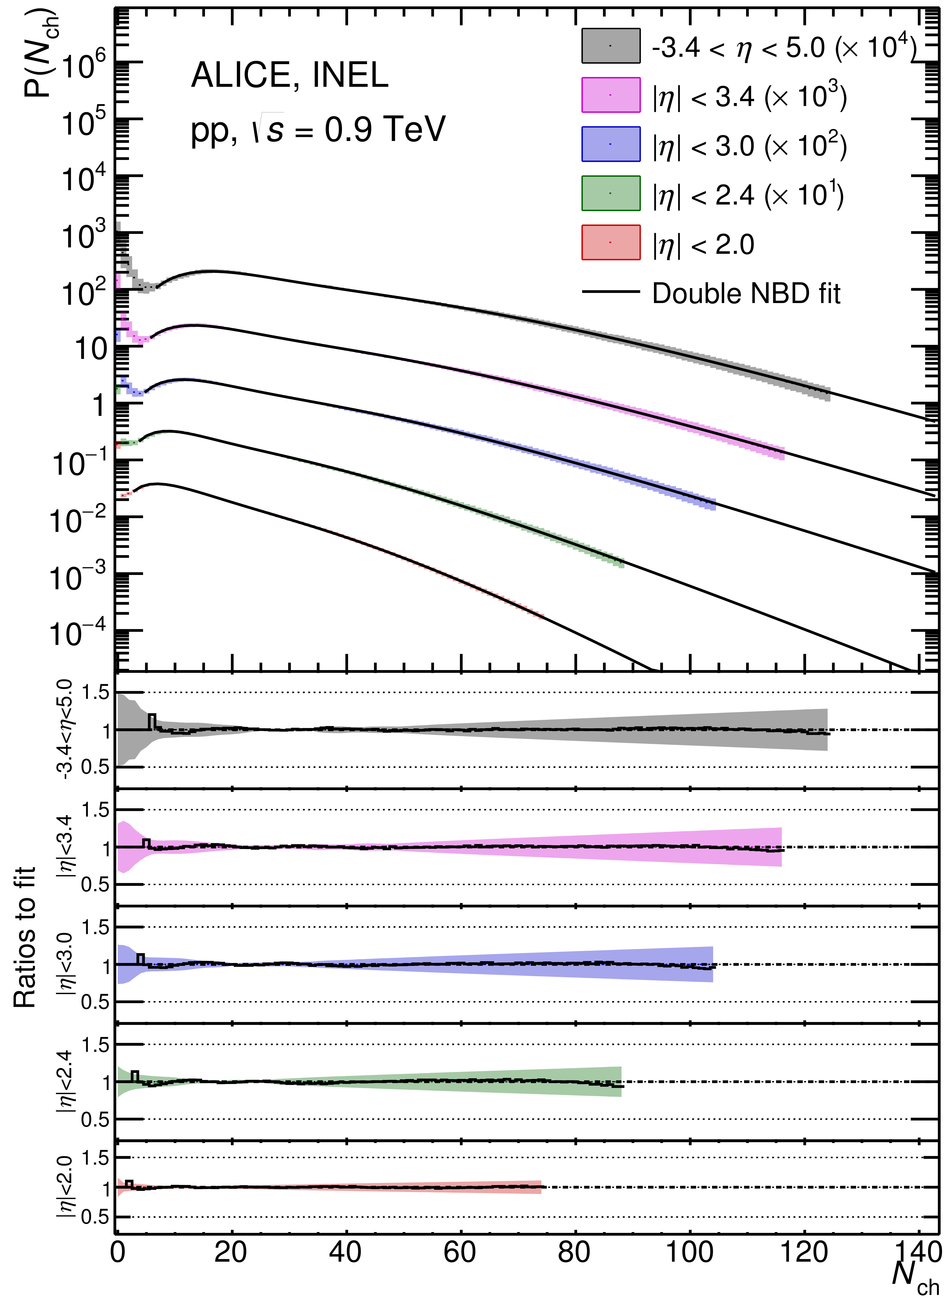  |
Figure 4
Charged-particle multiplicity distributions for NSD (top left), INEL (top right) and INEL$>$0 (bottom) pp collisions at $\sqrt{s}=7$ TeV The lines show fits to double NBDs Ratios of the data to the fits are also presented Combined systematic and statistical uncertainties are shown as bands. |  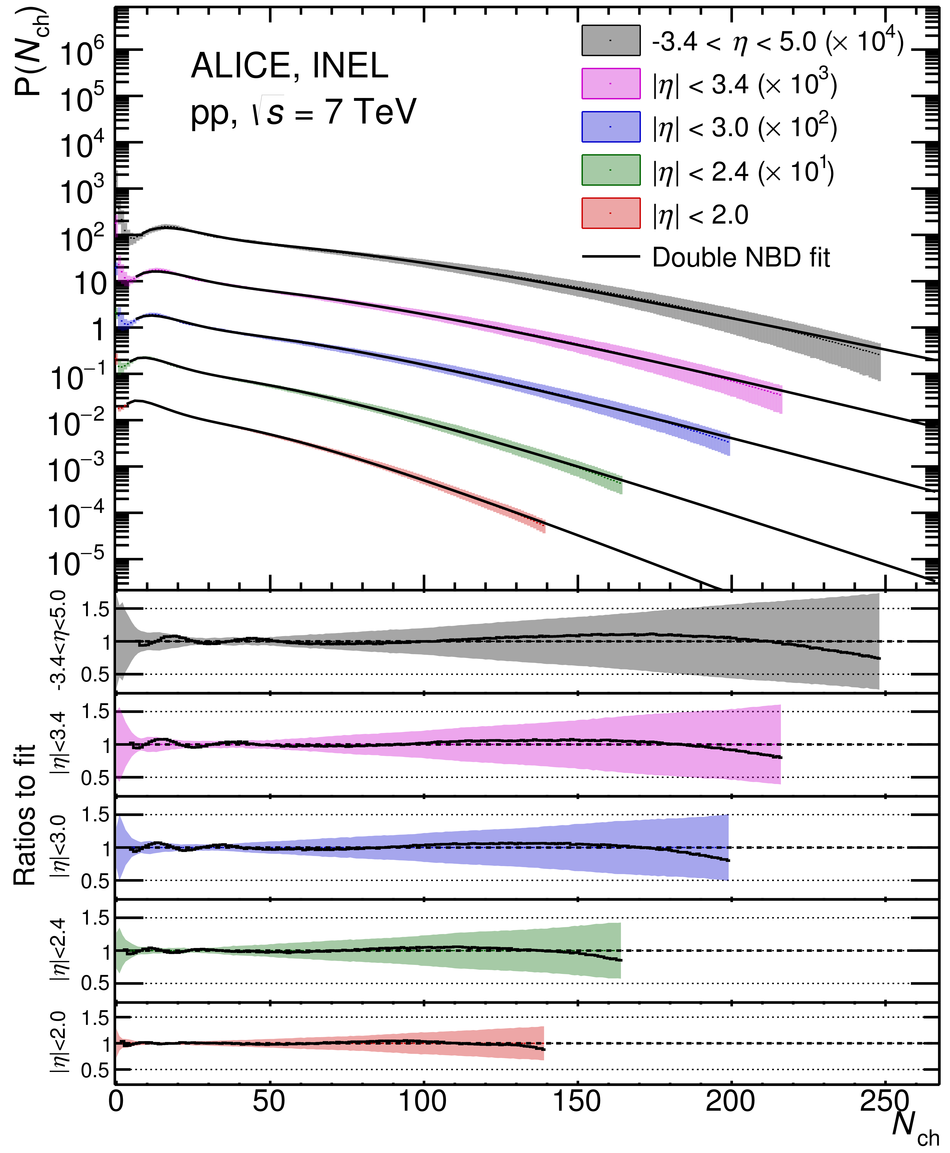  |
Figure 5
Charged-particle multiplicity distributions for NSD (top left), INEL (top right) and INEL$>$0 (bottom) pp collisions at $\sqrt{s}=8$ TeV The lines show fits to double NBDs Ratios of the data to the fits are also presented Combined systematic and statistical uncertainties are shown as bands. | 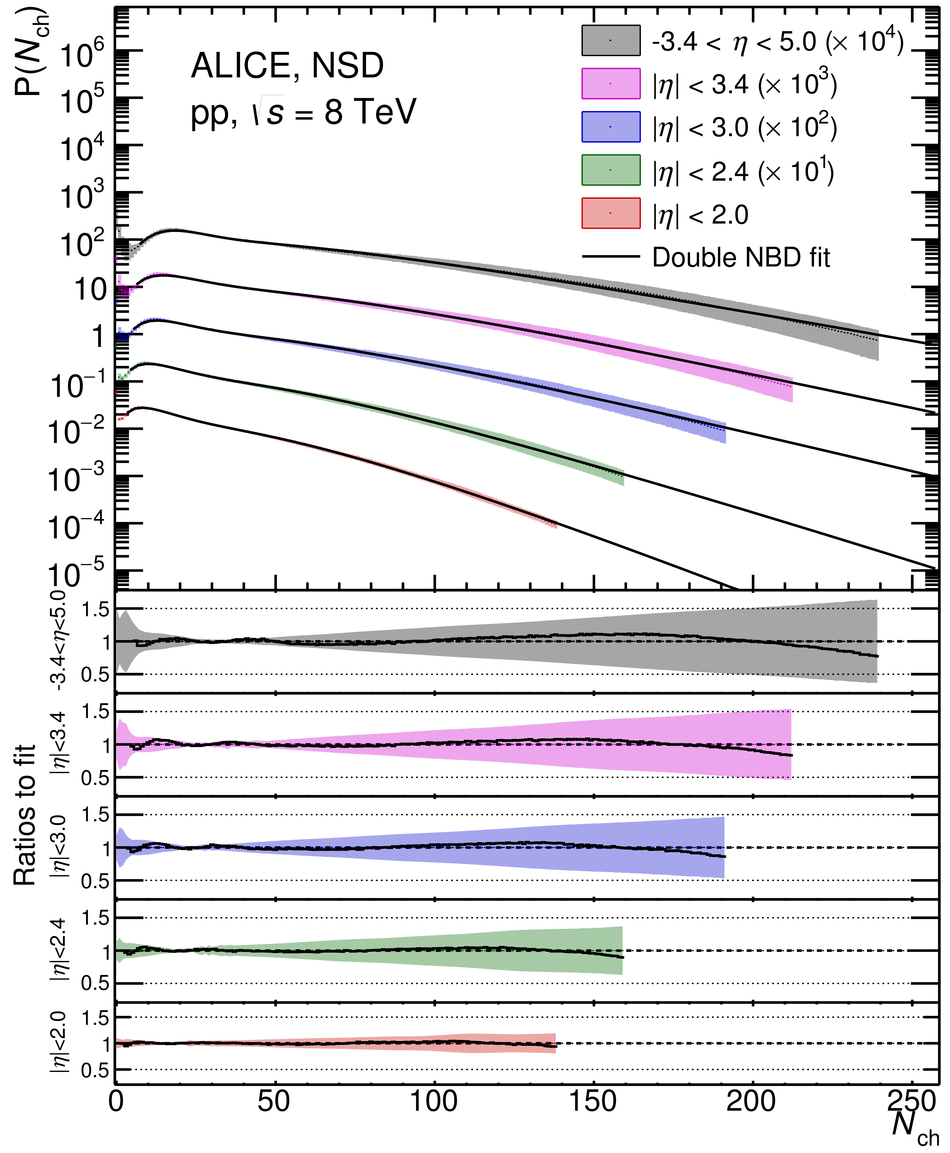   |
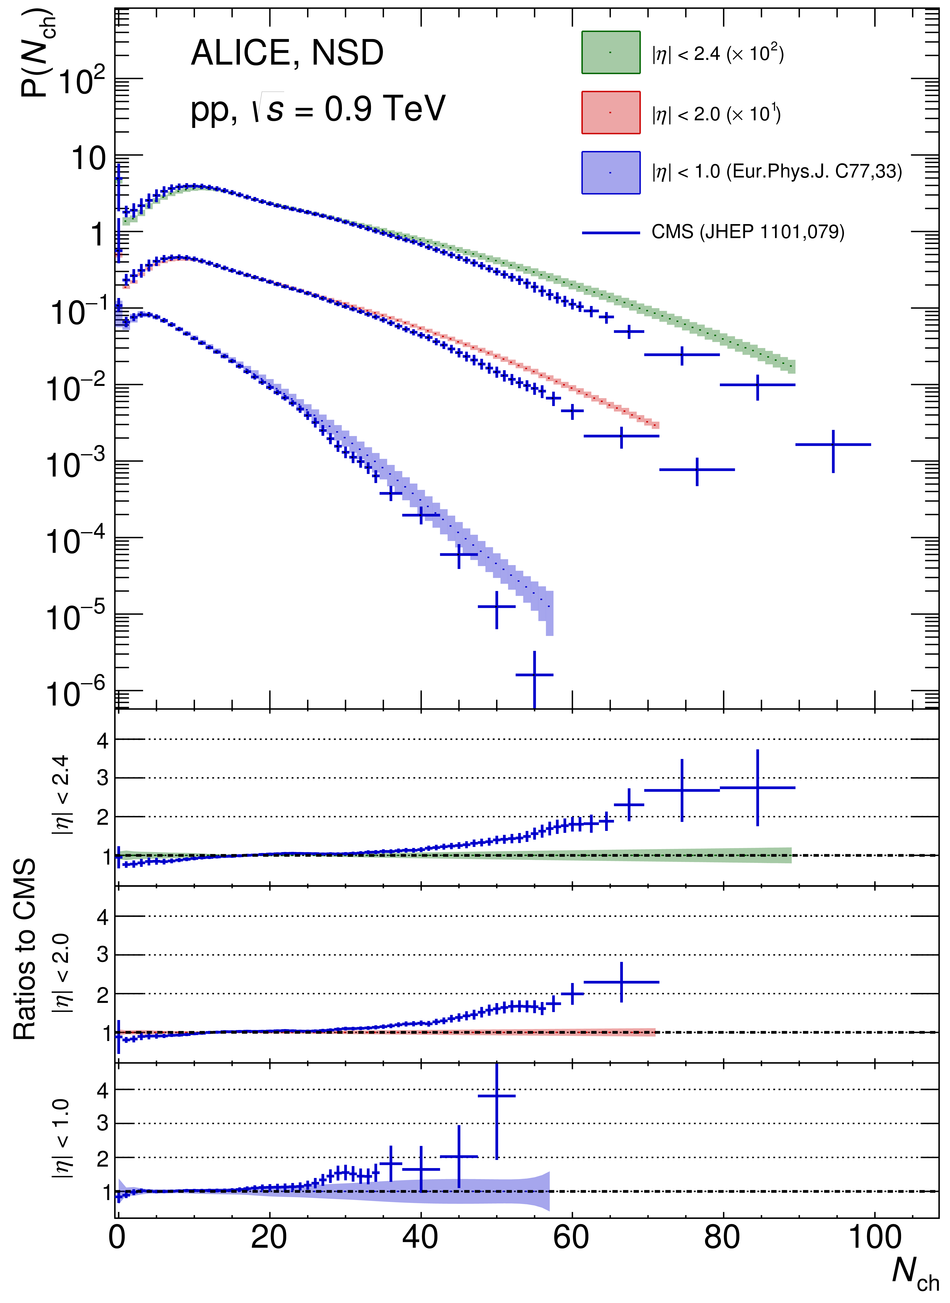
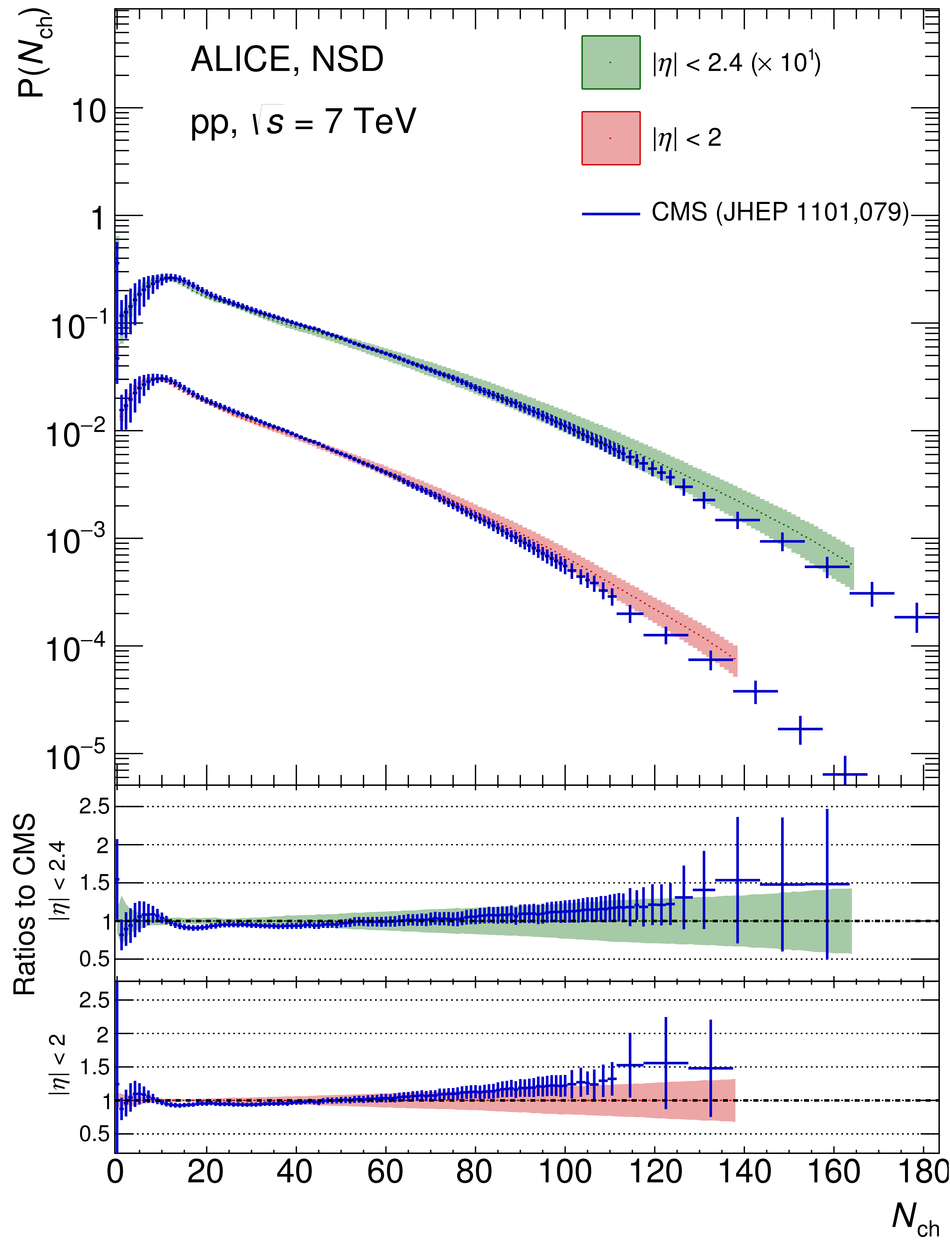
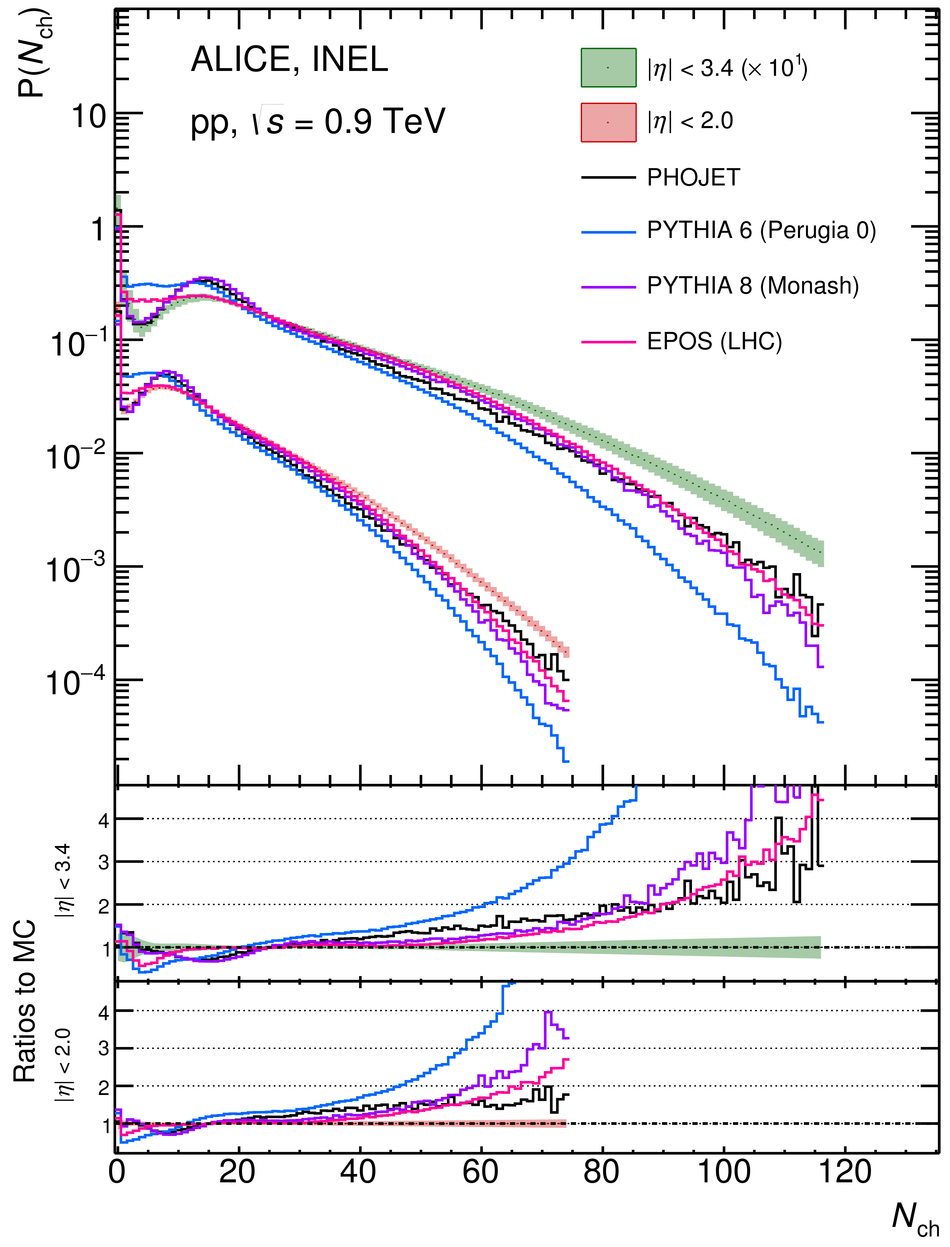
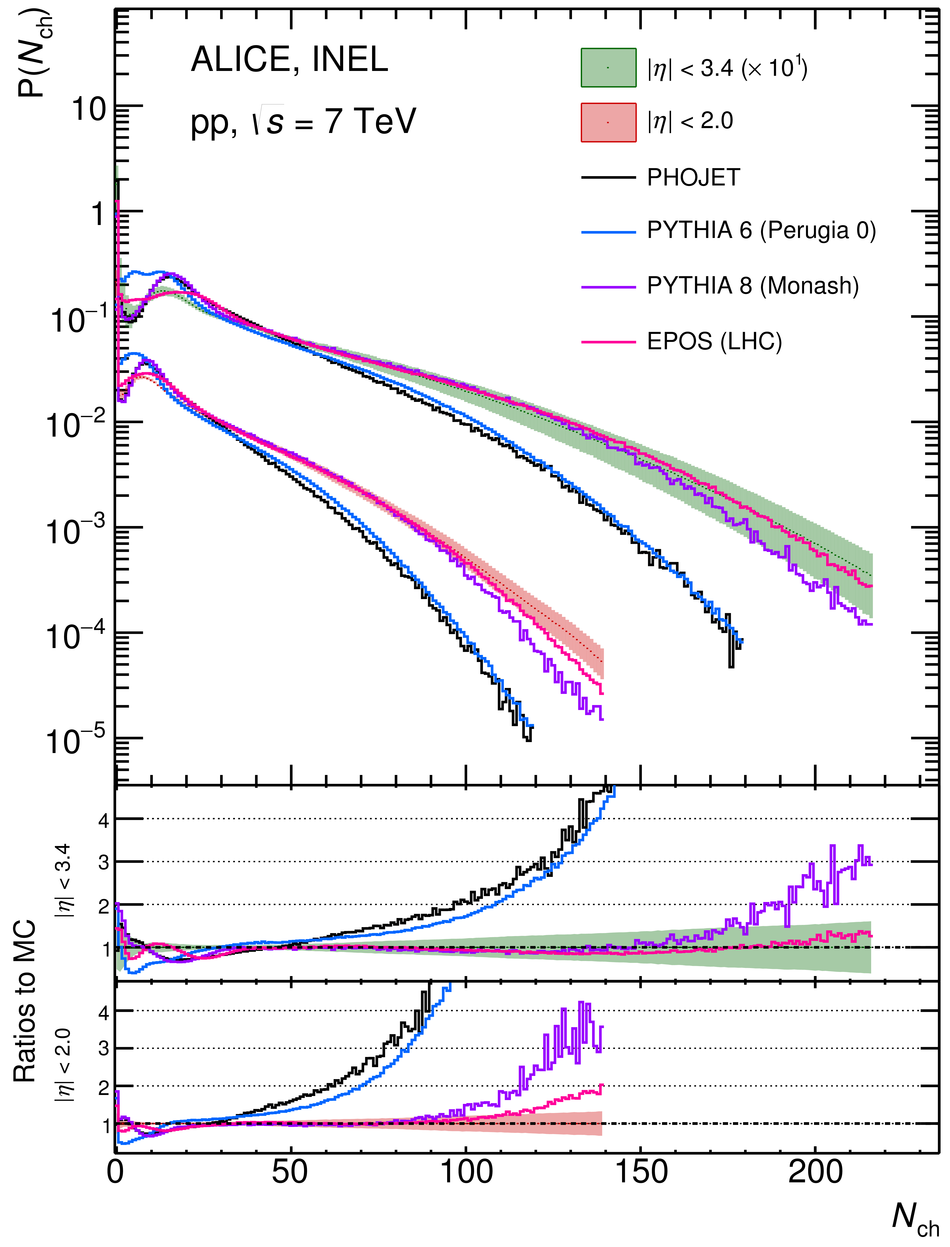
Figure 8
Charged-particle multiplicity distributions for pp collisions at $\sqrt{s}=7$ TeV compared to distributions from the IP-Glasma model with the ratio between $Q_{s}$ and the color charge density either fixed (green stars), allowed to fluctuate with a Gaussian (blue squares) or with additional fluctuations of proton saturation scale (black diamonds) . | 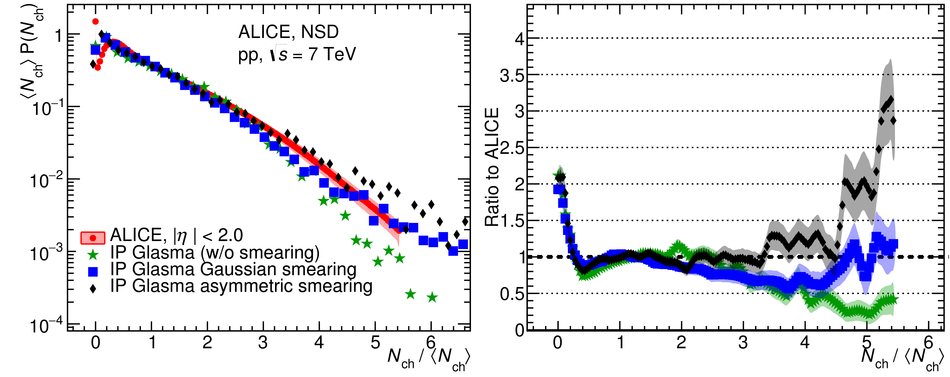 |