Comparison of near-side peak associated yield (top row) and near-side peak width (bottom row) values measured in p-Pb collisions at $\sqrtsNN=5.02 \tev$ with the expectations from simulations performed with different Monte-Carlo event generators. Statistical and systematic uncertainties are shown as error bars and boxes, respectively. | 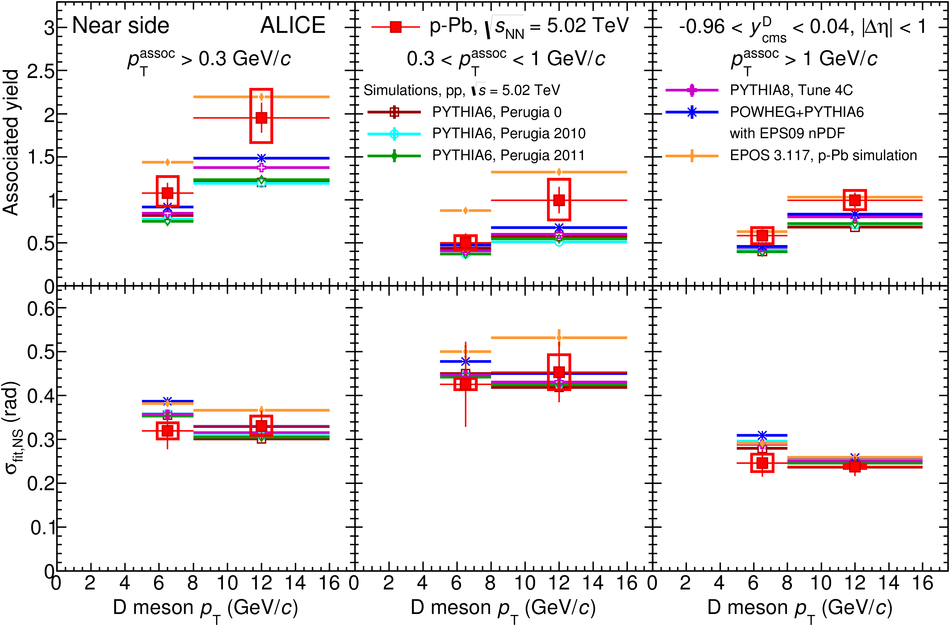 |