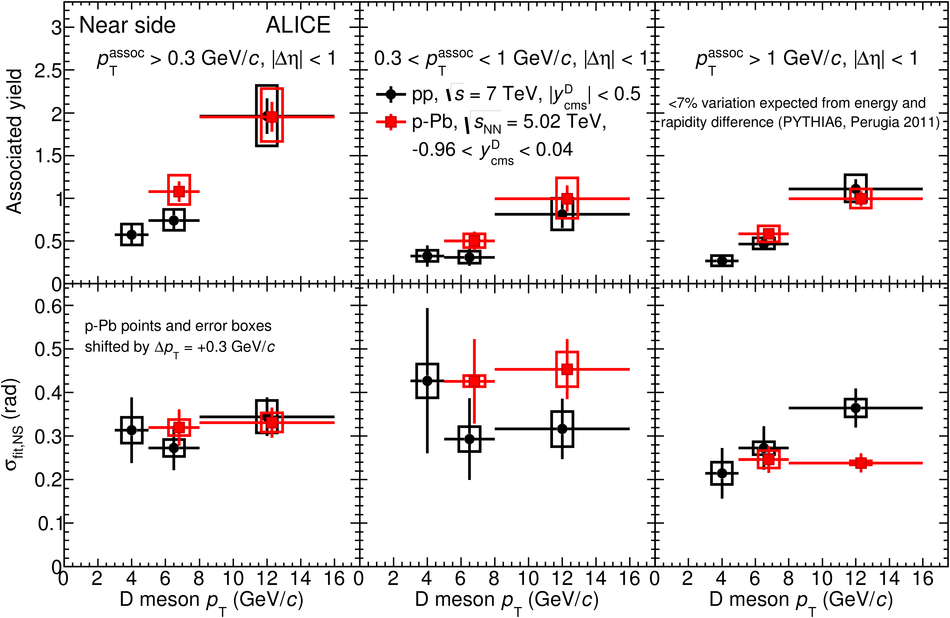
Comparison of the near-side peak associated yield (top row) and peak width (bottom row) in pp and $p-P$ collisions as a function of $p_{\rm T}^{\rm D}$, for $p_{\rm T}^{\rm assoc}>0.3 \gevc$ (left column), $0.3< p_{\rm T}^{\rm assoc}< 1 \gevc$ (middle column), and $p_{\rm T}^{\rm assoc}>1 \gevc$ (right column). The points and error boxes for p-Pb collisions are shifted by $\Delta\pt = +0.3 \gevc$. Statistical and systematic uncertainties are shown as error bars and boxes, respectively. |  |