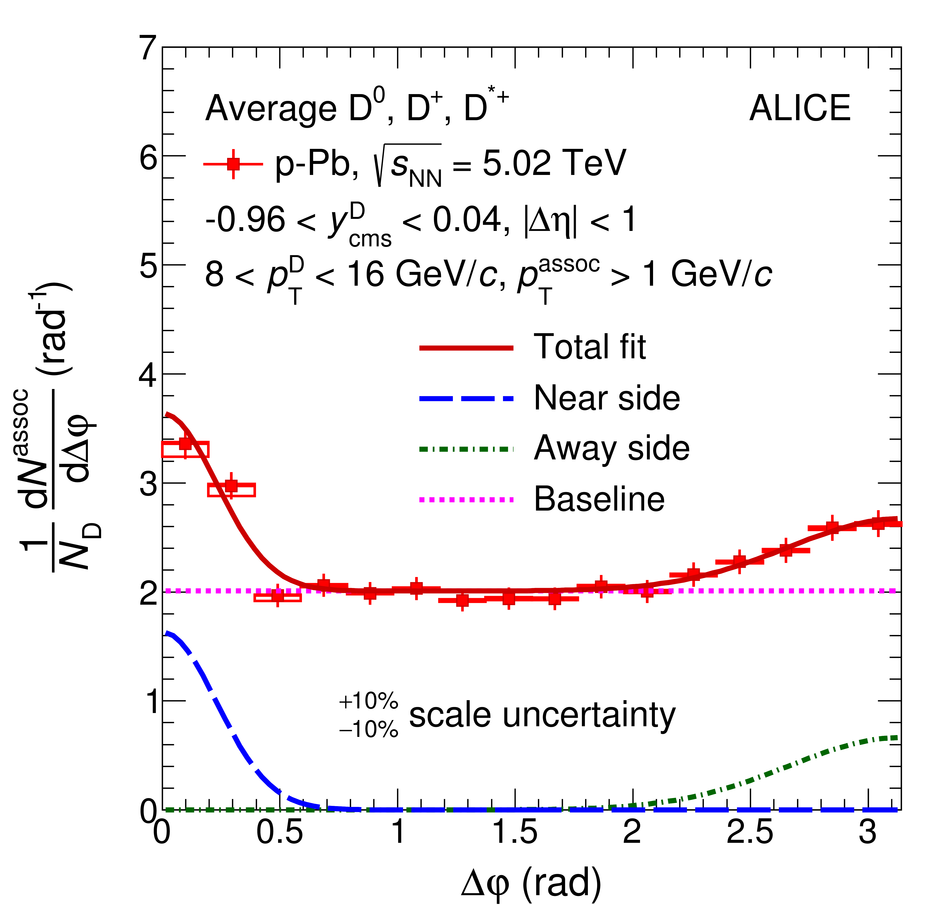
Examples of the fit to the azimuthal-correlation distribution, for D mesons with $5< p_{\rm T}^{\rm D}< 8 \gevc$ with charged particles with $p_{\rm T}^{\rm assoc}>1 \gevc$ in pp collisions at $\sqrts=7 \tev$ (left), and for D mesons with $8< p_{\rm T}^{\rm D}< 16 \gevc$ with charged particles with $p_{\rm T}^{\rm assoc}>1 \gevc$ in p--Pb collisions at $\sqrtsNN=5.02 \tev$ (right). The statistical uncertainties are shown as error bars, the $\Delta\varphi$-uncorrelated systematic uncertainties as boxes, while the part of systematic uncertainty correlated in $\Delta\varphi$ is reported as text (scale uncertainty). The terms of the fit function described in Section 3.3 are also shown separately: near-side Gaussian function (blue dashed line), away-side Gaussian function (green dashed-dotted line) and baseline constant term (magenta dotted line). | 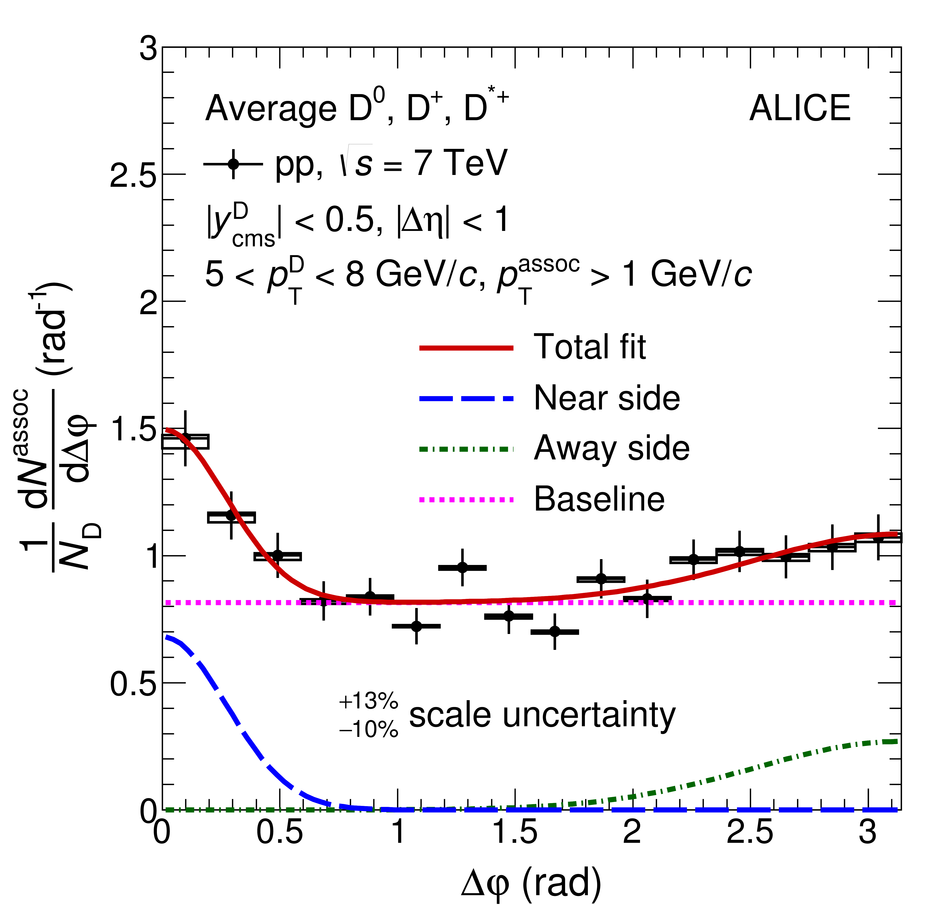 |