$v_{n}$ coefficients, $n=2, 3, 4$, obtained from (a) $P_2$ and (b) $R_2$ correlators, as a function of $|\Delta\eta|$ in the 5% most central Pb - Pb collisions Statistical errors are shown as vertical solid lines whereas systematic uncertainties are displayed as shaded bands. Panels (c - d): ratios of the $v_{n}$, $n=2, 3, 4$, by the corresponding values of $v_{n}$ measured at $\Delta\eta = 0.3$. | 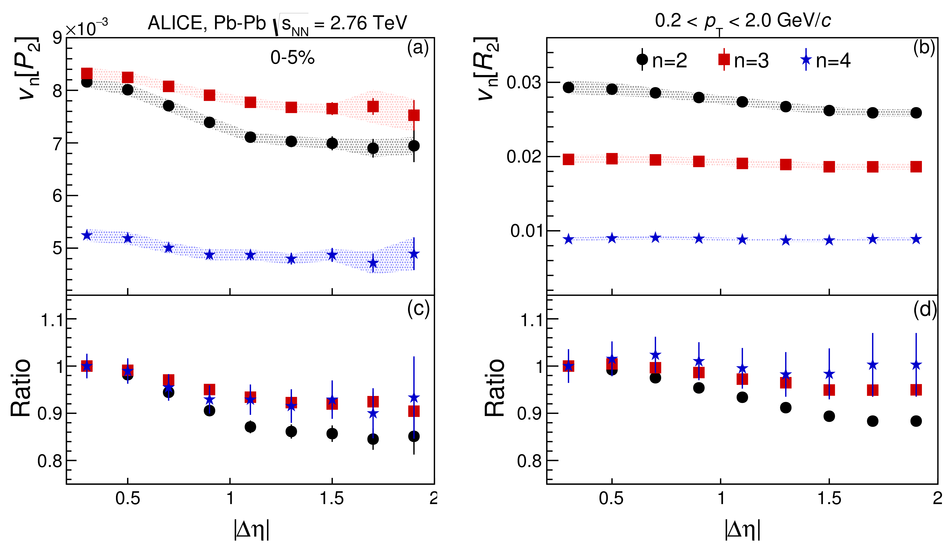 |