Invariant mass spectra in selected $pt$ slices in PCM (left) and PHOS (right) in the $\pi^0$ and $\eta$ meson mass regions. The histogram and the bullets show the data before and after background subtraction, respectively. The curve is a fit to the invariant mass spectrum after background subtraction. | 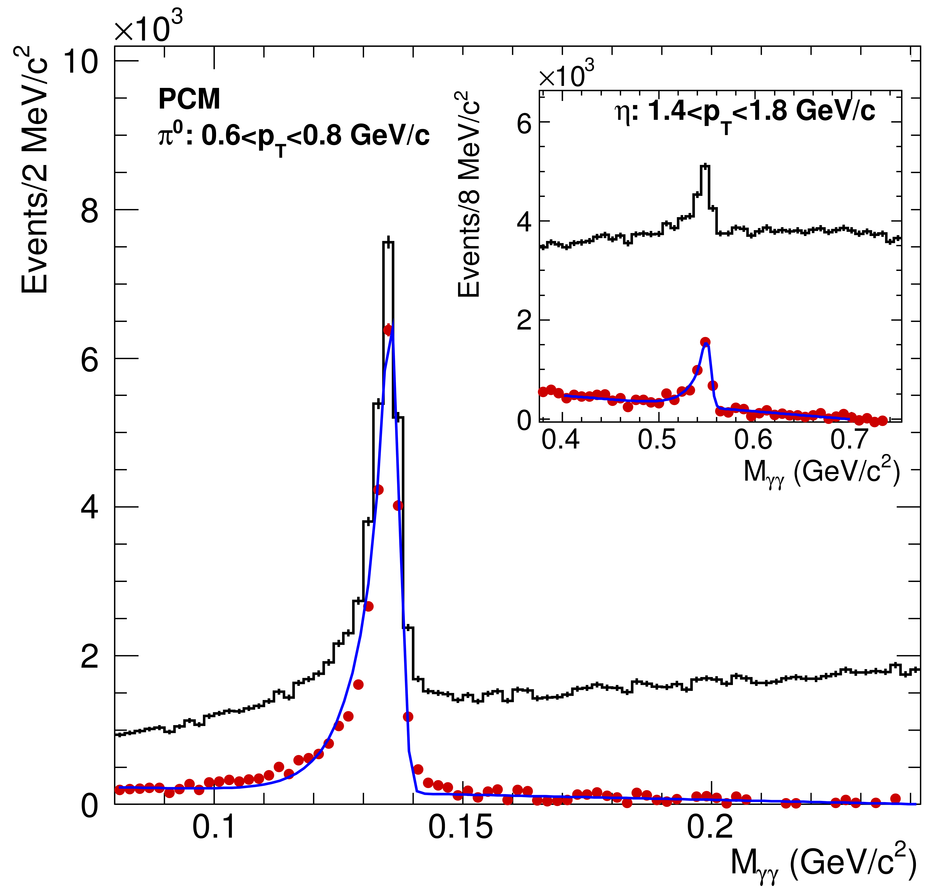 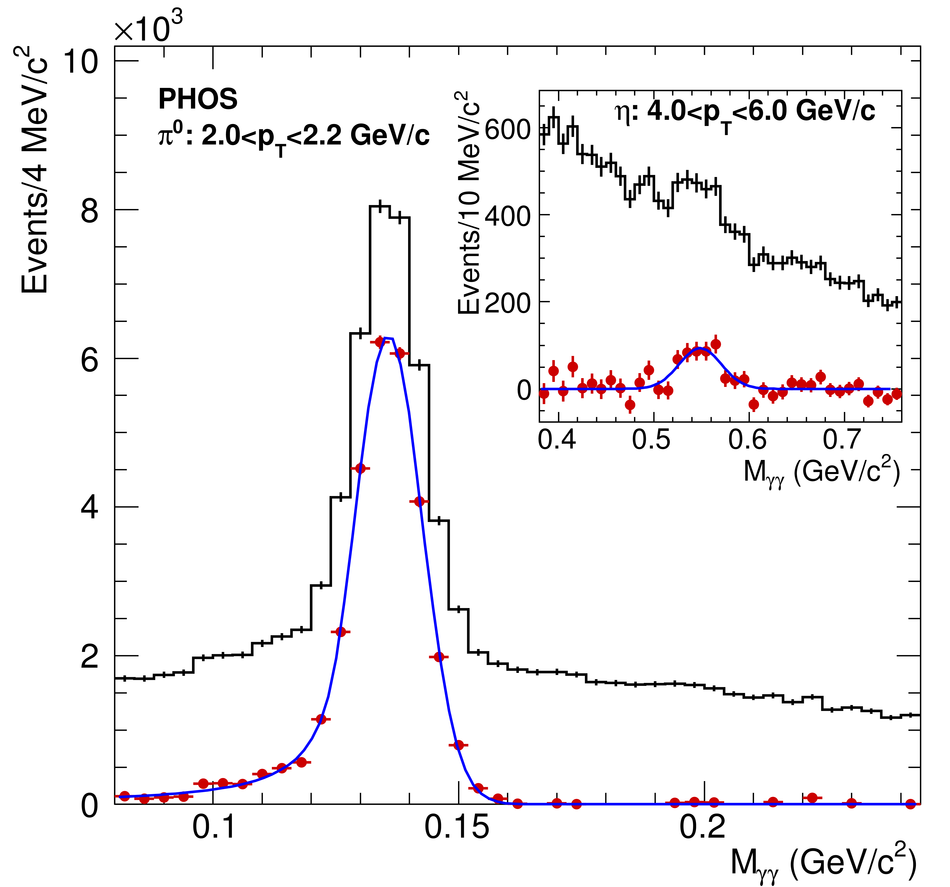 |