The production of muons from heavy flavour decays is measured at forward rapidity in proton--proton collisions at $\sqrt s$ = 7 TeV collected with the ALICE experiment at the LHC. The analysis is carried out on a data sample corresponding to an integrated luminosity $L_{int}$ = 16.5 n$b^{-1}$. The transverse momentum and rapidity differential production cross sections of muons from heavy flavour decays are measured in the rapidity range 2.5 <~ y <~ 4, over the transverse momentum range 2 <~ $p_{t}$ <~ 12 GeV/c. The results are compared to predictions based on perturbative QCD calculations.
Phys. Lett. B 708 (2012) 265
HEP Data
e-Print: arXiv:1201.3791 | PDF | inSPIRE
CERN-PH-EP-2011-215
Figure 1
Transverse momentum distribution of reconstructed tracks in the muon spectrometer after all selection cuts were applied (see section 3.1 for details). The distributions were obtained from a PYTHIA [34,35] (tune Perugia-0[35]) simulation of pp collisions at $\sqrt s$ = 7 TeV The main sources are indicated in the figure. | 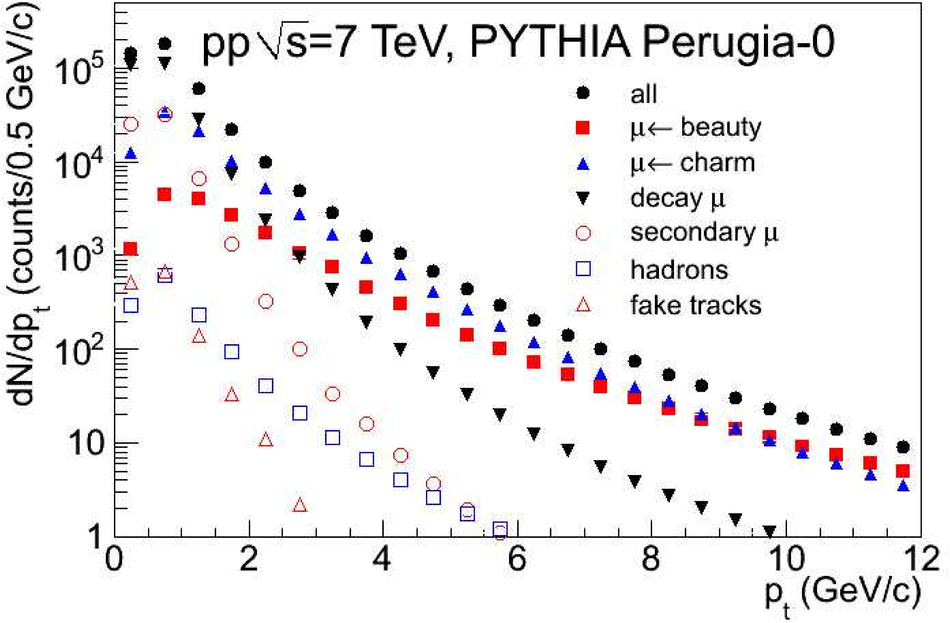 |
Figure 3
Left: $\pt$-differential production cross section of muons from heavy flavour decays in the rapidity range $2.5 < y < 4$. Right:y-differential production cross section of muons from heavy flavour decays, in the range $2 < p_{\rm t} < 12$ GeV/$c$. In both panels, the error bars (empty boxes) represent the statistical (systematic) uncertainties. A 3.5$\%$ normalization uncertainty is not shown. The solid curves are FONLL calculations and the bands display the theoretical systematic uncertainties. Also shown, are the FONLL calculations and systematic theoretical uncertainties for muons from charm (long dashed curves) and beauty(dashed curves) decays. The lower panels show the corresponding ratios between data and FONLL calculations. | 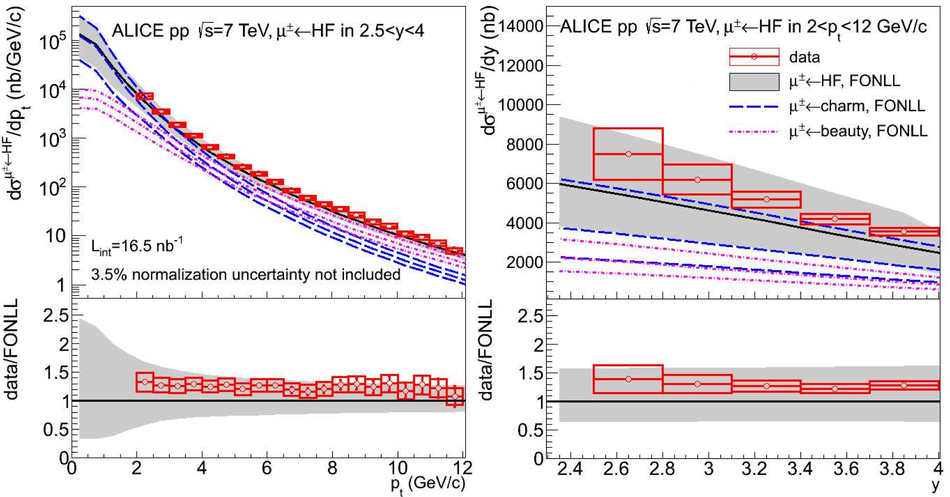 |
Figure 4
Upper panel: $\pt$-differential production cross section of muons from heavy flavour decays in five rapidity regions mentioned in the figures The error bars (empty boxes) represent the statistical (systematic) uncertainties. A 3.5$\%$ normalization uncertainty is not shown. The solid curves are FONLL calculations and the bands display the theoretical systematic uncertainty. Lower panel: ratio between data and FONLL calculations. | 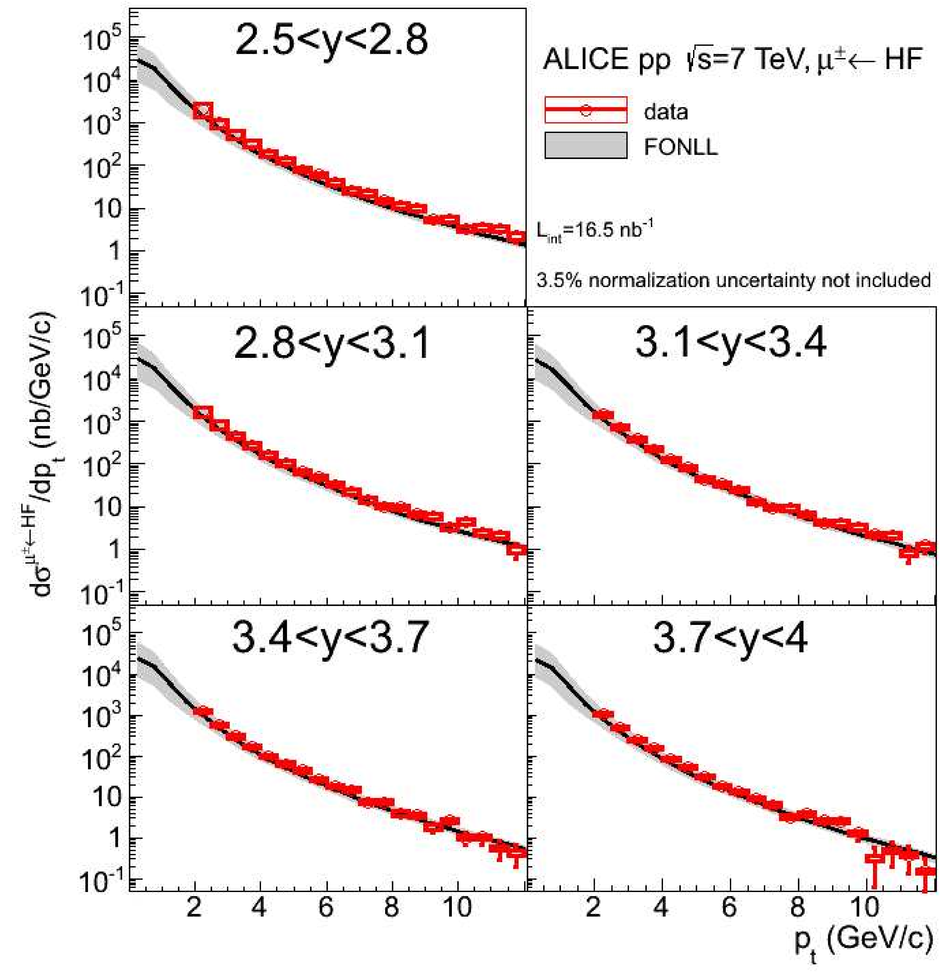 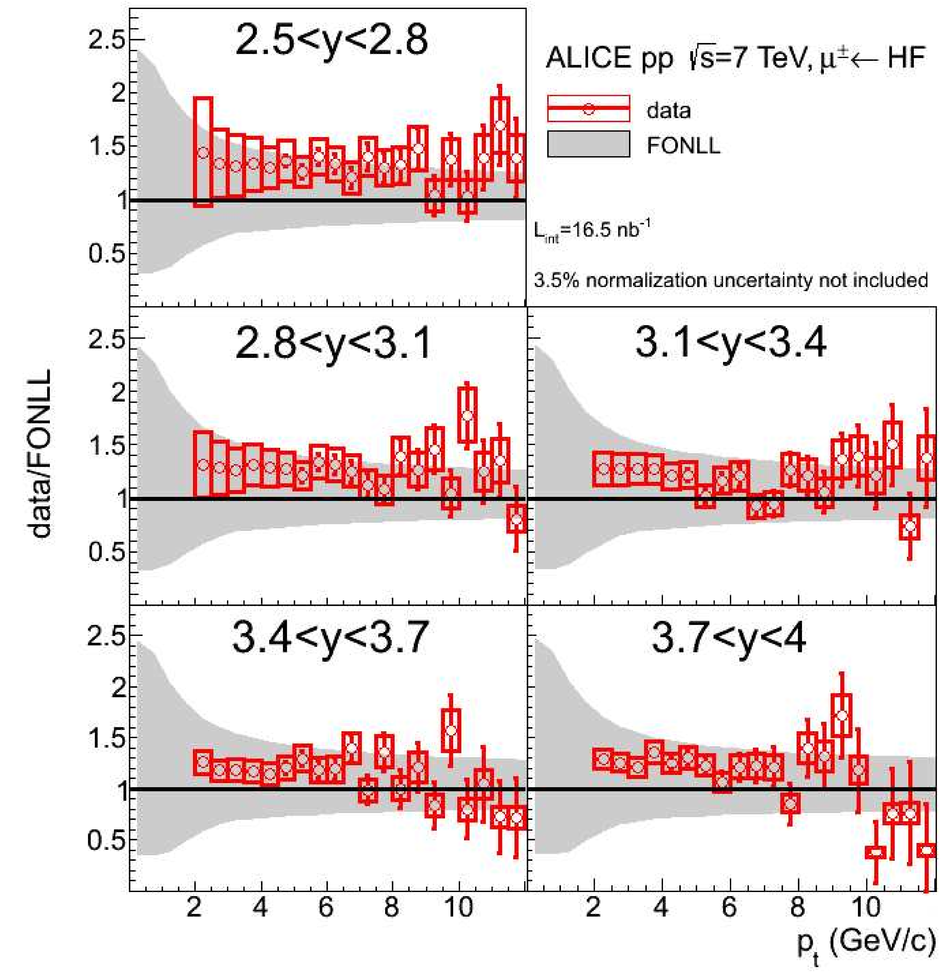 |