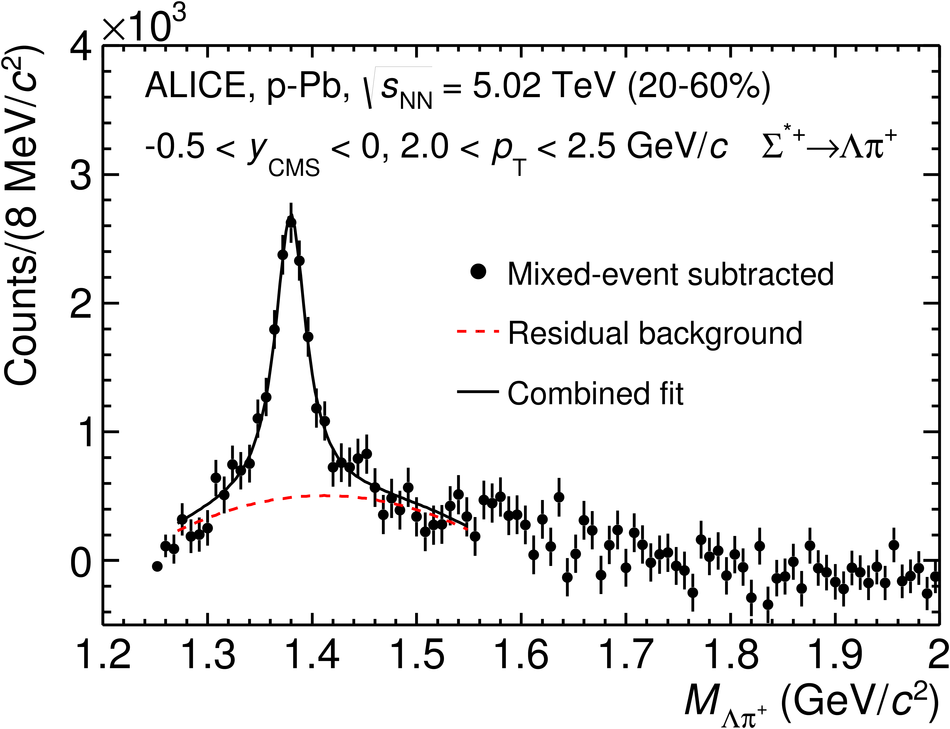
(Left) The $\Lambda\pi^{+}$ invariant mass distribution (Same-event pairs) in 2.0 $< \pt < $ 2.5 GeV/$c$ and for the multiplicity class 20-60%. The background shape,using pairs from different events (Mixed-event background),is normalised to the counts in 1.9 $< M_{\Lambda\pi}< $ 2.0 GeV/$c^2$. (Right) The invariant mass distribution after subtraction of the mixed-event background. The solid curve represents the combined fit, while the dashed line describes the residual background | 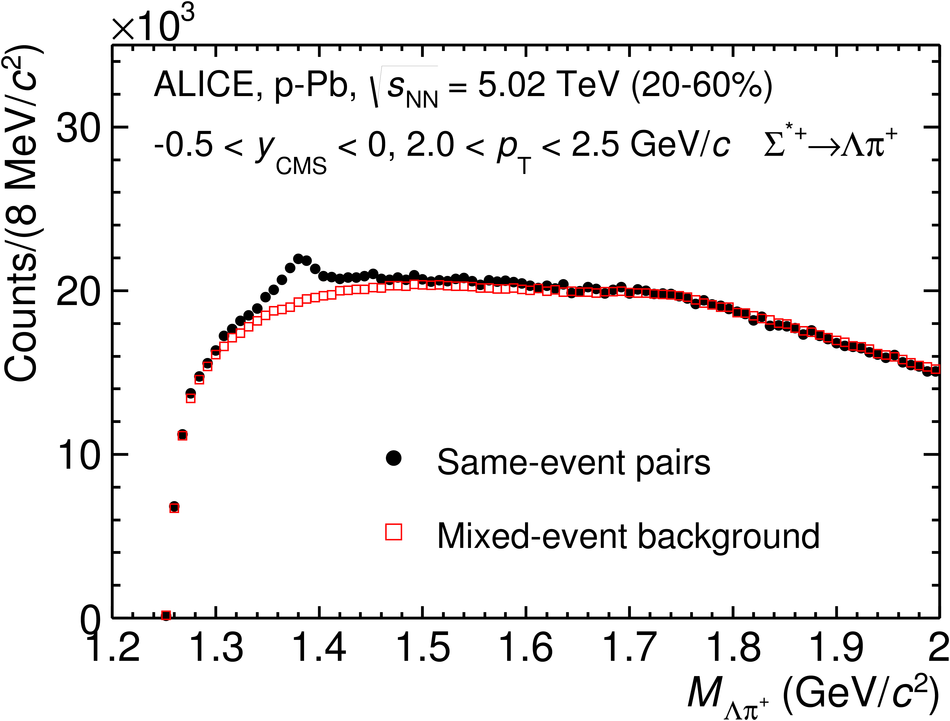 |