AMPT model predictions are shown as hollow symbols in the (top) and (middle) panels. (top) Comparison of observables SC(4,2) (red filled squares) and SC(3,2) (blue filled circles) to theoretical model from. Solid lines indicate the predictions with constant $\eta/s$, while the dashed lines indicate predictions for different parameterizations of $\eta/s$ temperature dependence (labeled in the same way as in Fig.1 in). (middle) Results divided by $\left< v_m^2\right>\left< v_n^2\right>$. (bottom) Comparison to MC-Glauber using wounded nucleon (WN) and binary collisions (BC) weights. | 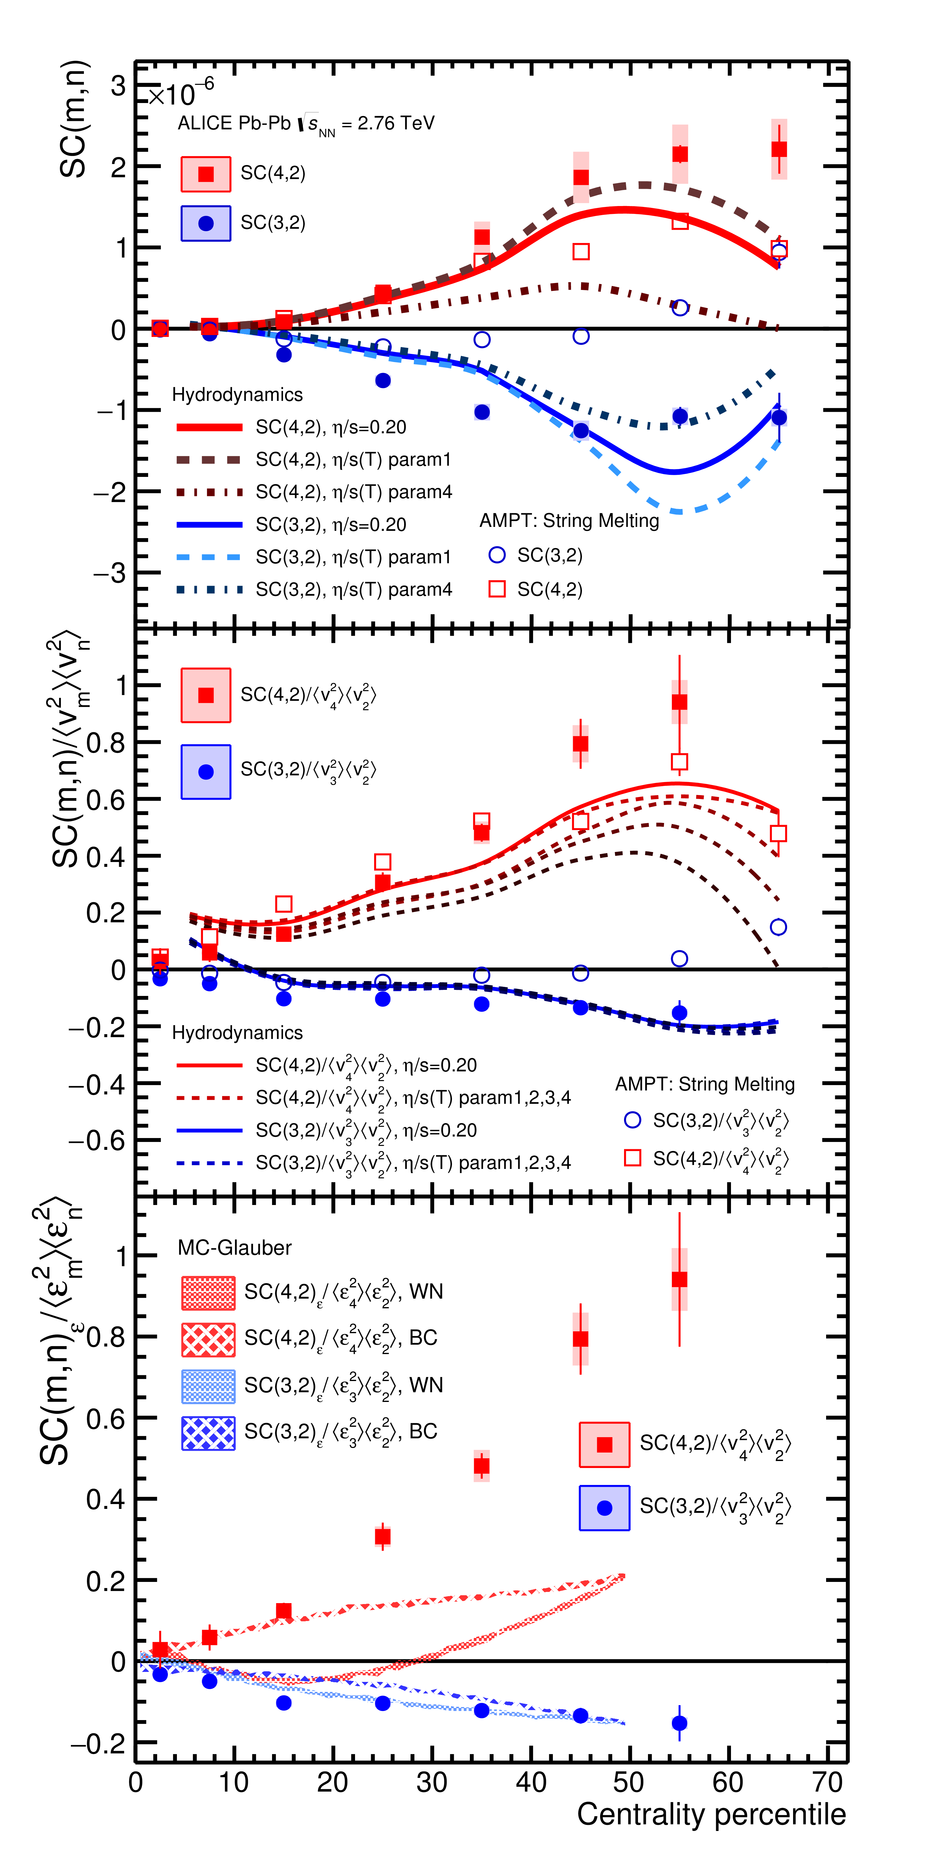 |