The W and Z boson production was measured via the muonic decay channel in proton-lead collisions at $\sqrt{s_{\rm NN}} = 5.02$ TeV at the Large Hadron Collider with the ALICE detector. The measurement covers backward ($-4.46 <~ y_{\rm cms} <~ -2.96$) and forward ($2.03 <~ y_{\rm cms} <~ 3.53$) rapidity regions, corresponding to Pb-going and p-going directions, respectively. The Z-boson production cross section, with dimuon invariant mass of $60<~m_{\mu\mu}<~120$ GeV/$c^2$ and muon transverse momentum ($p_{\rm T}^\mu$) larger than 20 GeV/$c$, is measured. The production cross section and charge asymmetry of muons from W-boson decays with $p_{\rm T}^\mu>10$ GeV/$c$ are determined. The results are compared to theoretical calculations both with and without including the nuclear modification of the parton distribution functions. The W-boson production is also studied as a function of the collision centrality: the cross section of muons from W-boson decays is found to scale with the average number of binary nucleon-nucleon collisions within uncertainties.
JHEP 02 (2017) 077
HEP Data
e-Print: arXiv:1611.03002 | PDF | inSPIRE
CERN-EP-2016-278
Figure 1
Invariant-mass distribution of unlike-sign muon pairs with $\pt>20$ GeV$c$ in the Pb-going (left panel) and p-going (right panel) data samples. In the p-going one, the solid line represents the distribution obtained using POWHEG simulations and normalised to the number of Z candidates in the data. | 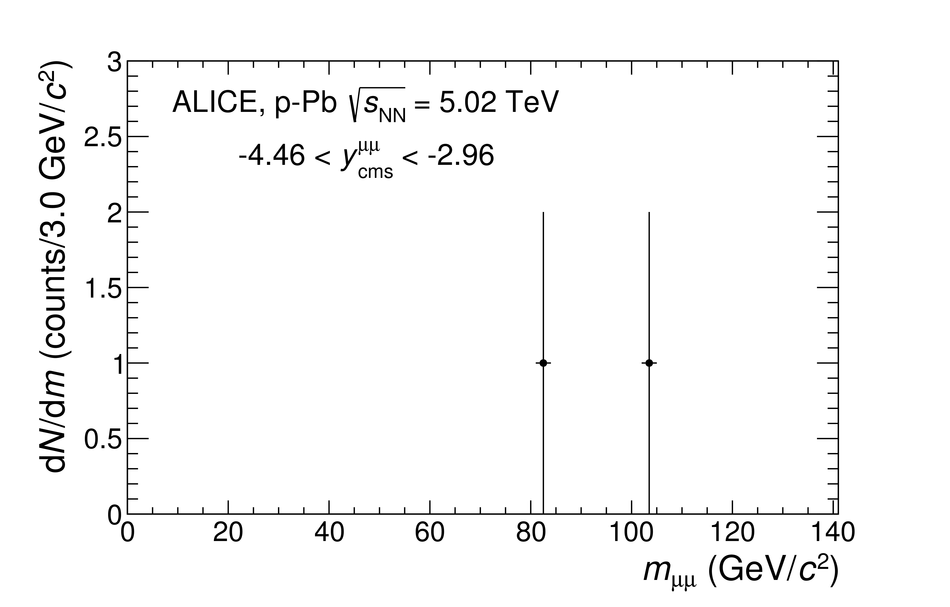 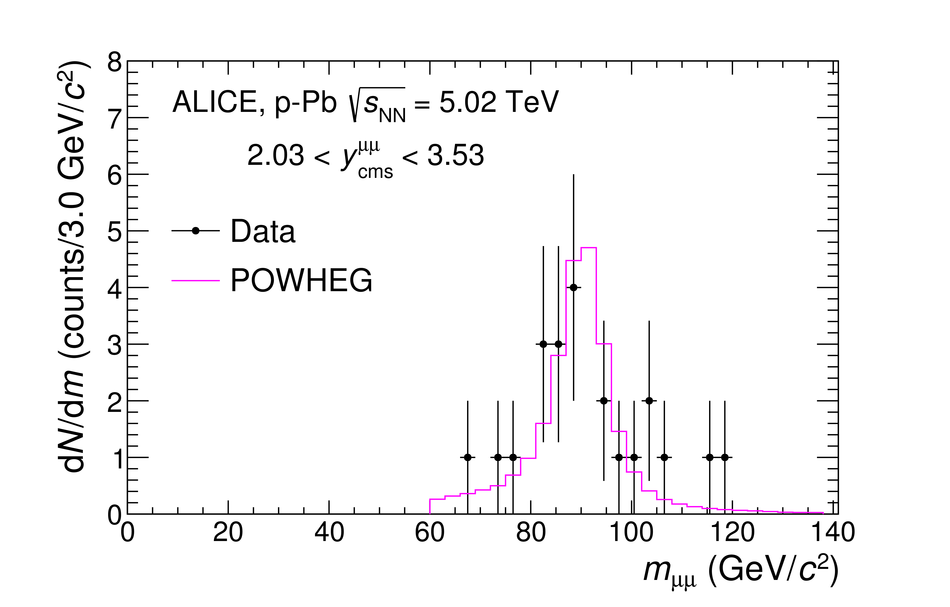 |
Figure 2
Top panels: inclusive distribution of positive (left) and negative (right) charge muon candidates measured in the Pb-going (top) and p-going (bottom) data taking periods. The results of the MC template fit for the extraction of the $\mu^{+} \leftarrow \mathrm{W}^{+}$ and $\mu^{-} \leftarrow \mathrm{W}^{-}$ signal is shown. In this case, the central value of the FONLL calculations is used for the background description while POWHEG with the CT10 PDF set paired with EPS09NLO is used for W and Z boson production. Bottom panels: relative difference of data and the extrapolated fit results in the range $10< \pt< 80 \gev/c$. | 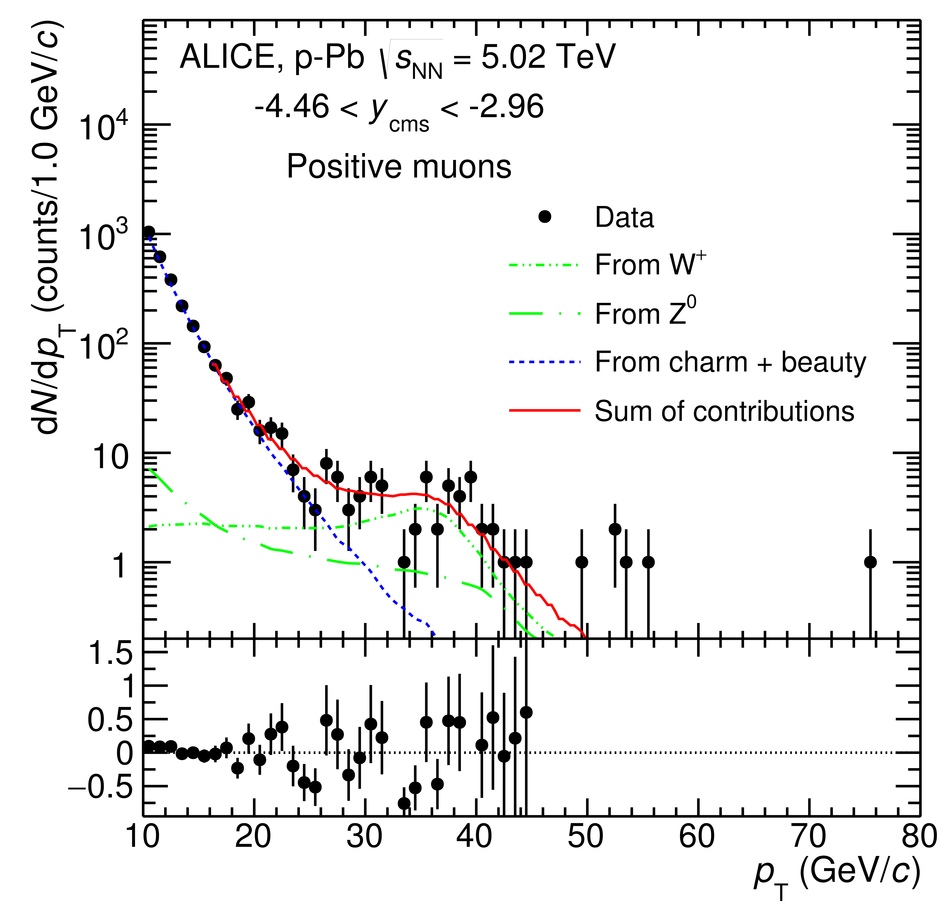 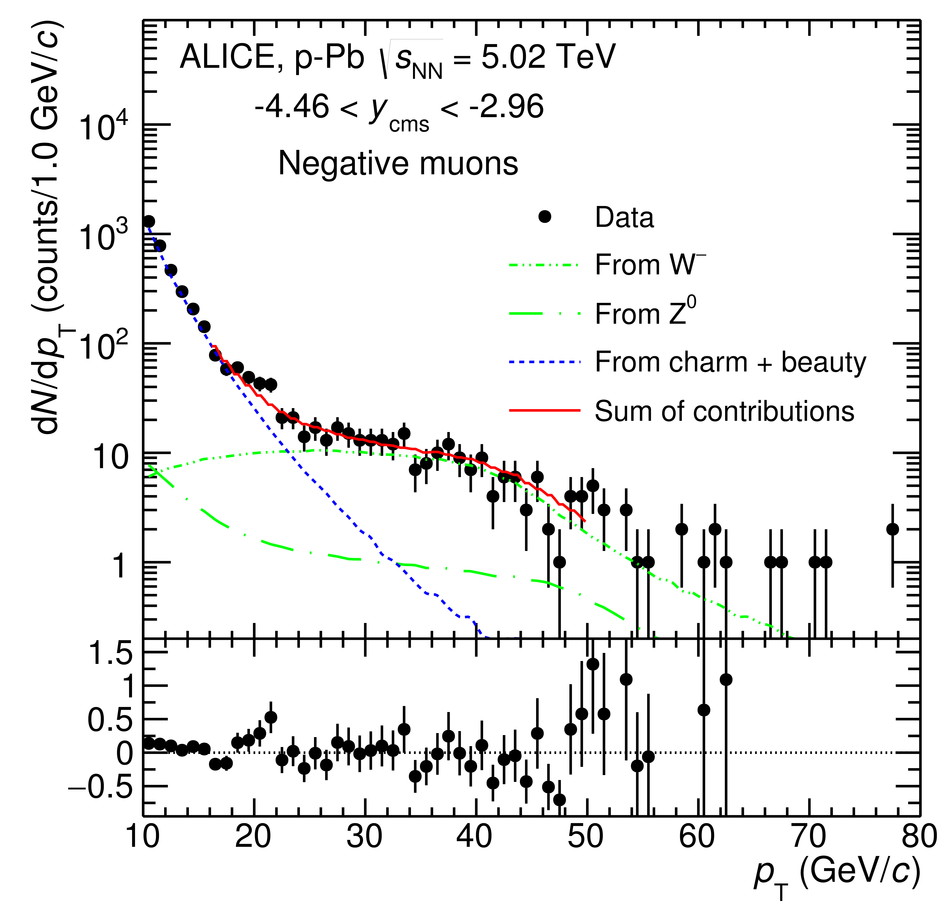 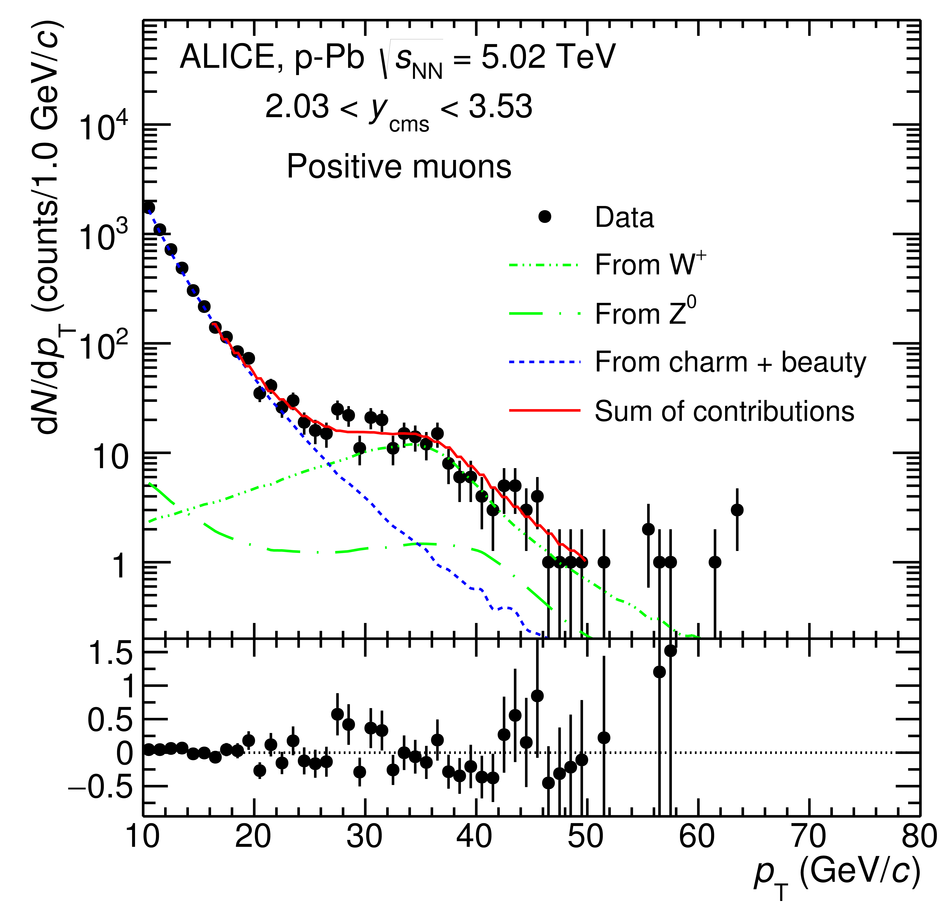  |
Figure 3
Z-boson production cross section in the dimuon decay channel at backward and forward rapidities measured in p-Pb collisions at $\snn = 5.02$ TeV. The vertical error bars (open boxes) represent the statistical (systematic) uncertainties. The horizontal width of the boxes corresponds to the measured rapidity range. The results are compared with theoretical calculations [26, 46] performed both with and without including the nuclear modification of the parton distribution functions. In the top panel, the calculations are shifted along the rapidity axis to improve the visibility. The middle (bottom) panel shows the data and pQCD (FEWZ) calculations divided by the pQCD (FEWZ) calculations without nuclear modification of the PDFs. | 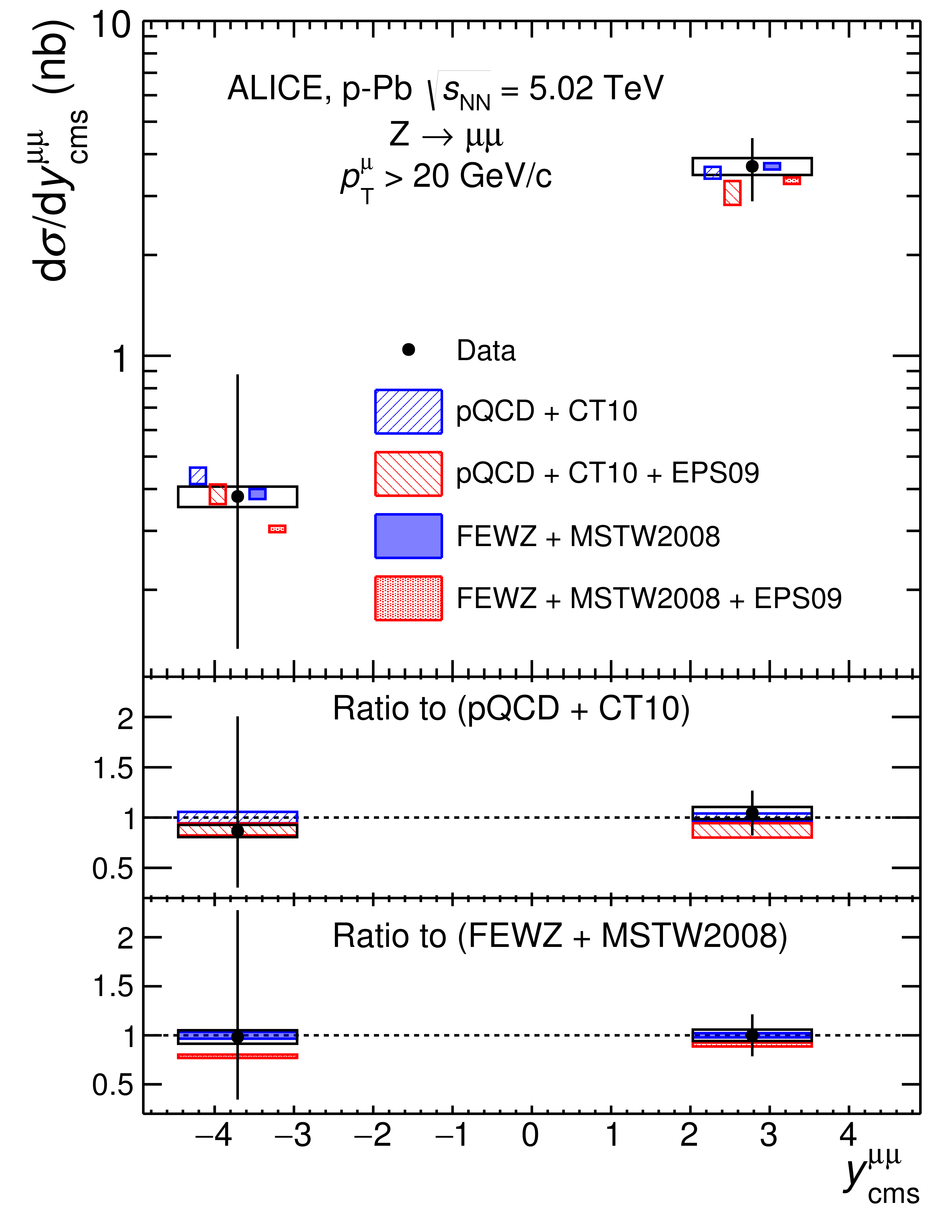 |
Figure 4
Ratio of data over theoretical calculations for the Z-boson production cross section measured by the ALICE, LHCb [18], ATLAS [16] and CMS [17] experiments. The LHCb points have been shifted by +0.02 units of rapidity for better visibility. The ATLAS cross sections are measured in a slightly smaller invariant mass range ($66 < m_{ll} < 116$ GeV/$c^2$) compared to the other experiments ($60 < m_{ll} < 120$ GeV/$c^2$). The luminosity uncertainties of 2.7% for ATLAS and 3.5% for CMS are not shown. The pQCD calculations are obtained with the CT10 PDF set and with the EPS09NLO parameterisation of the nuclear modifications. | 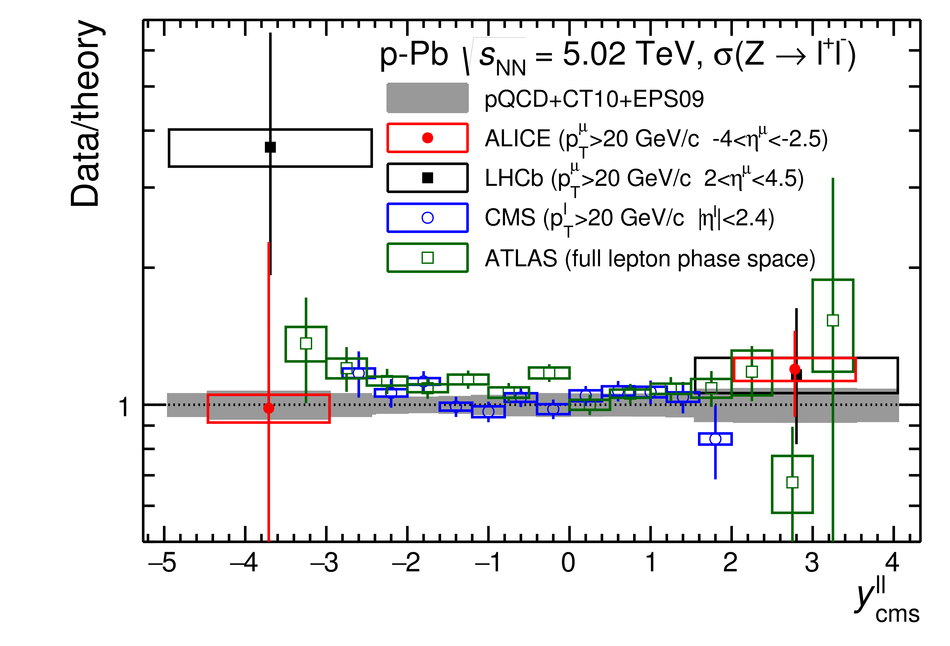 |
Figure 5
Left (right) panel: cross section of $\mu^+$ ($\mu^-$) from W$^+$ (W$^-$) boson decays at backward and forward rapidities measured in p-Pb collisions at $\snn = 5.02$ TeV. The vertical error bars (open boxes) represent the statistical (systematic) uncertainties. The horizontal width of the boxes corresponds to the measured rapidity range. The results are compared with theoretical calculations [24,26] performed both with and without including the nuclear modification of the parton distribution functions. In the top panels, the calculations are shifted along the rapidity axis to improve the visibility. The middle (bottom) panel shows the data and pQCD (FEWZ) calculations divided by the pQCD (FEWZ) calculations without nuclear modification of the PDFs. | 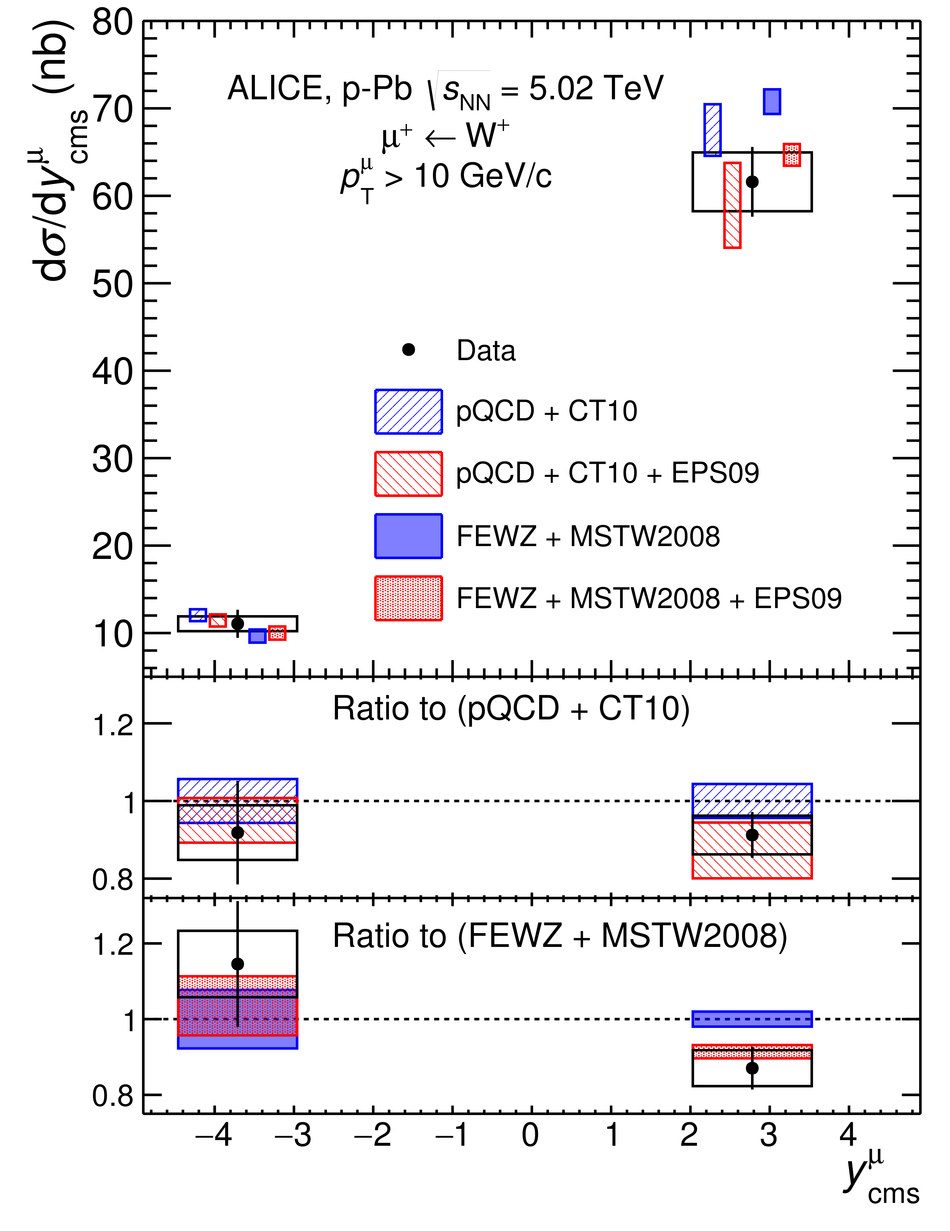  |
Figure 6
Lepton charge asymmetry of muons from W-boson decays at backward and forward rapidities measured in p-Pb collisions at $\snn = 5.02$ TeV. The vertical error bars (open boxes) represent the statistical (systematic) uncertainties. The horizontal width of the boxes corresponds to the measured rapidity range. The results are compared with theoretical calculations [26,46] performed both with and without including the nuclear modification of the parton distribution functions. In the top panel, the calculations are shifted along the rapidity axis to improve the visibility. The middle (bottom) panel shows the data and pQCD (FEWZ) calculations divided by the pQCD (FEWZ) calculations without nuclear modification of the PDFs. |  |
Figure 7
Ratio of data over theoretical calculations for the production cross section of positive (left panel) and negative (right panel) muons and leptons from W-boson production measured by the ALICE and CMS experiments [19], respectively. The luminosity uncertainty of 3.5% for CMS is not shown. The pQCD calculations are obtained with CT10 NLO PDF set and with the EPS09NLO parameterisation of the nuclear modifications. | 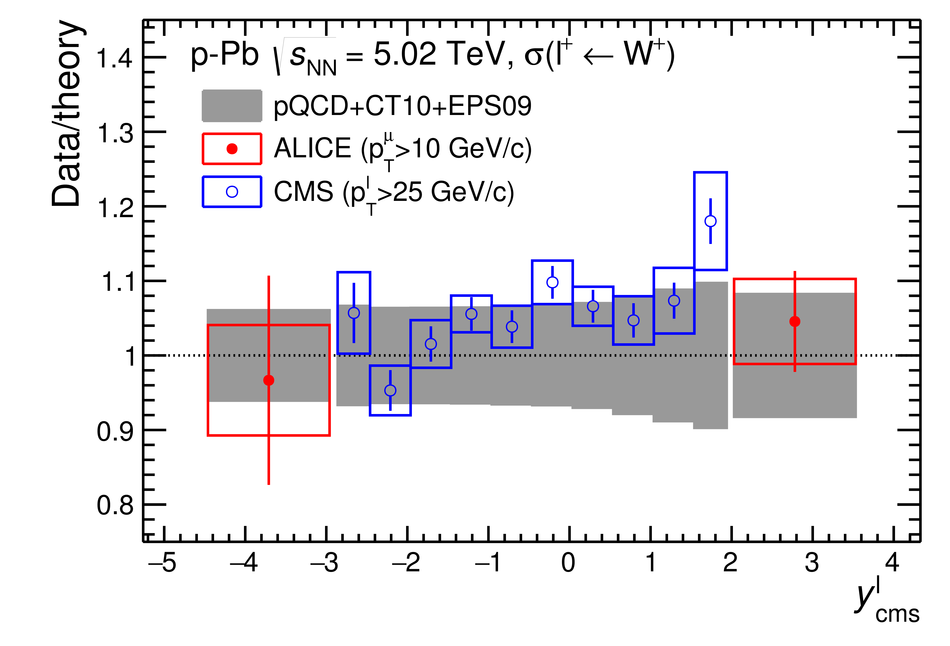 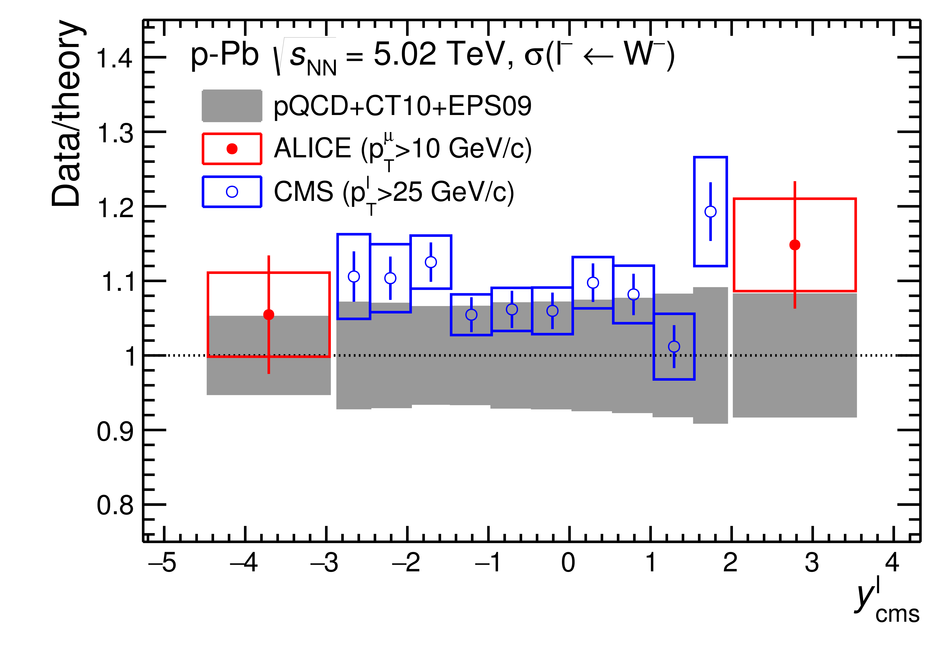 |
Figure 8
Sum of the cross sections of positive and negative charge muons from W boson decays measured in p-Pb collisions at $\snn = 5.02$ TeV in the rapidity region $-4.46 < y_{\rm cms} < -2.96$ (left panel) and $2.03 < y_{\rm cms} < 3.53$ (right panel) as a function of centrality. The cross sections are normalised by the number of binary collisions $\langle N_{\rm coll}^{\rm mult} \rangle$. The vertical bars (open boxes) represent the statistical (systematic) uncertainties. The correlated global uncertainties include the MB cross section, normalisation, $A \times \epsilon$ corrections and tracking and trigger systematics. A dotted line is drawn at the value of the centrality-integrated cross section to guide the eye. | 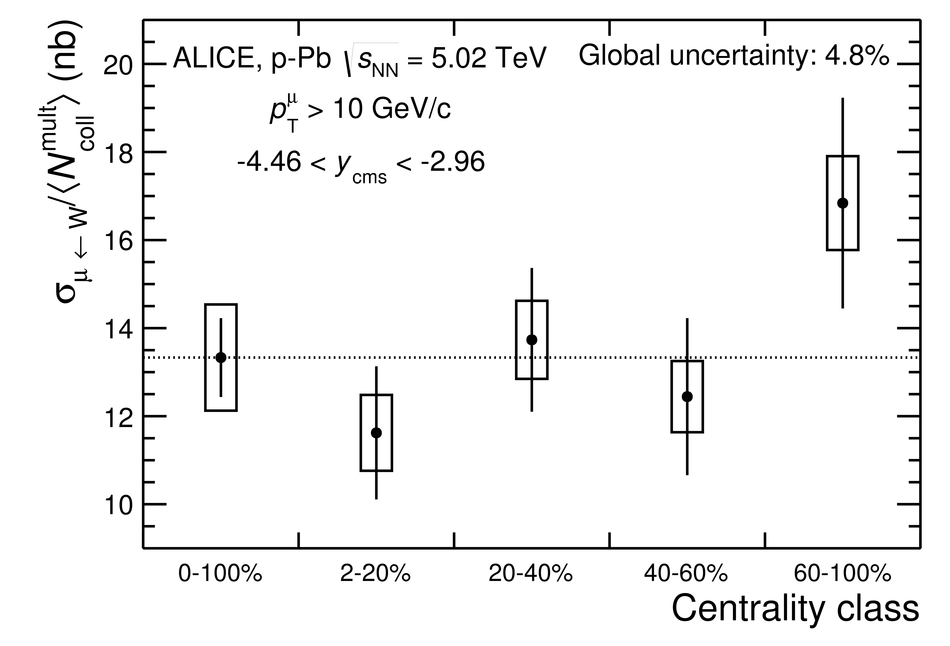 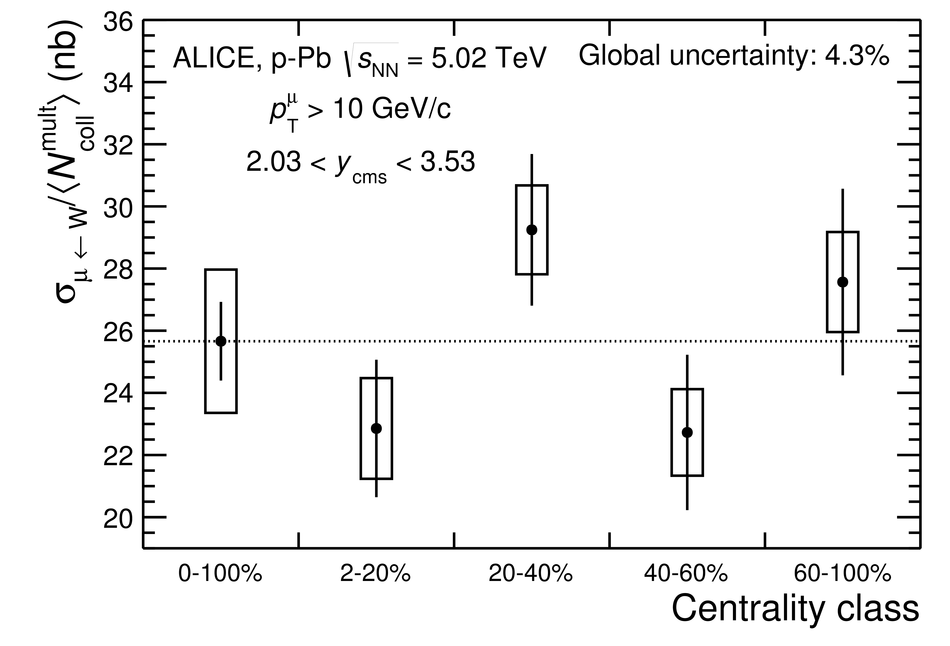 |