Largest pseudorapidity gap width distribution for 2-armevents, comparison between the data (black points) and various simulations (stage $d$). Left: dotted blue and solid red lines were obtained from default PYTHIA6 and PHOJET, respectively;dashed blue and dashed-dotted red lines were obtained by setting the DD fraction to zero in PYTHIA6 and PHOJET, respectively. Right: dotted blue and solid red lines are the same as on the left side; dashed blue and dashed-dotted red lines are for adjusted PYTHIA6 and PHOJET, respectively; the ratio of simulation to data is shown below with the same line styles for the four Monte Carlo calculations | 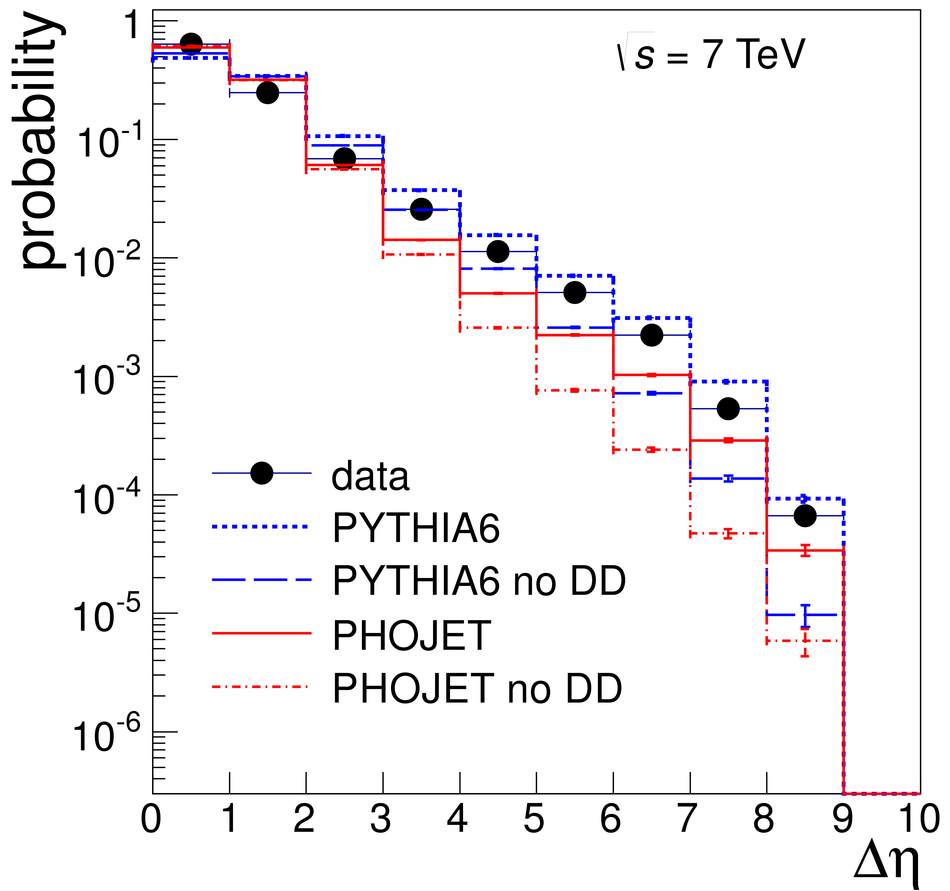 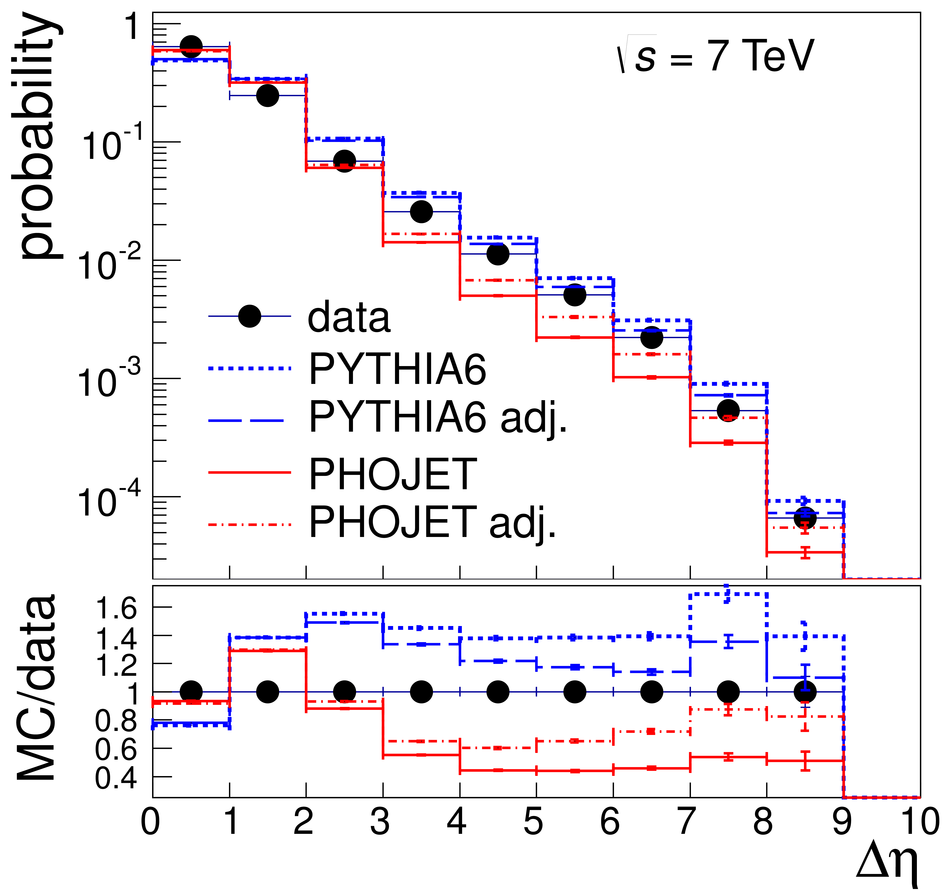 |