Missing yield in the depletion region relative to the overall peak yield extracted from the fit. Lines indicate statistical uncertainties (mostly smaller than the marker size), while boxes (only for data) denote systematic uncertainties. The arrows indicate the upper limit in case the uncertainty bands touch 0. The markers are placed at the centre of the centrality bins. For comparison, the non-zero values from two AMPT simulations are shown as lines. | 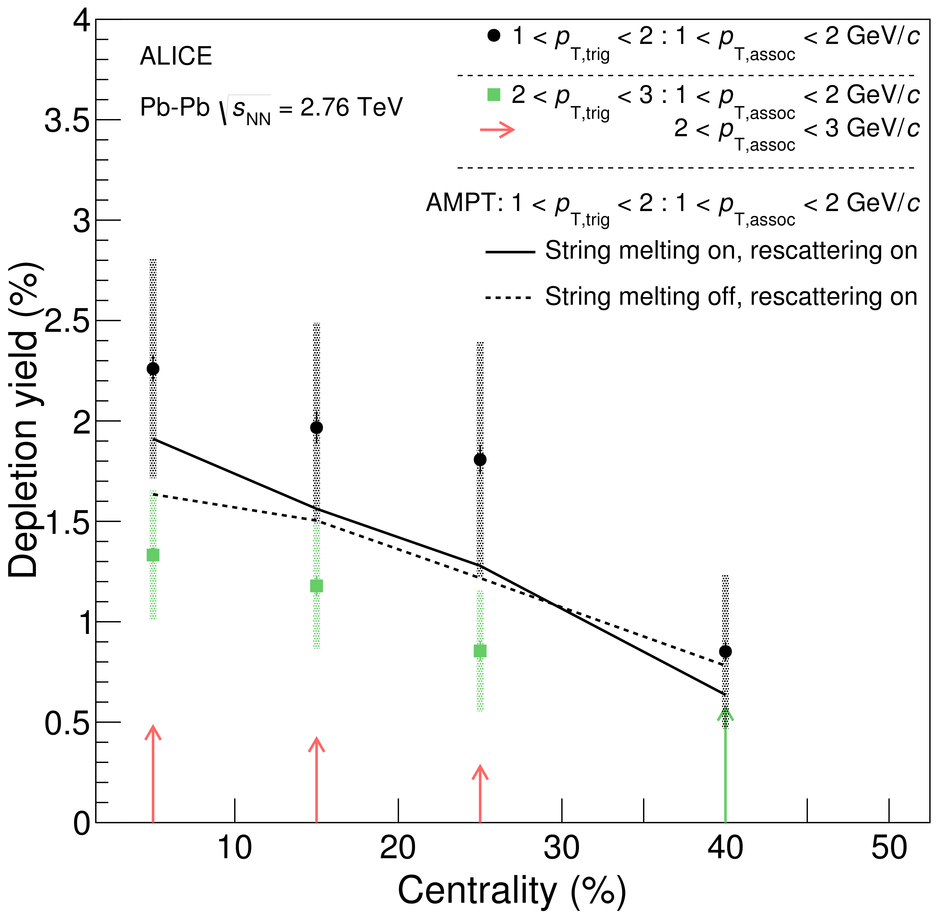 |