Coherent J/$ψ$ photoproduction in ultra-peripheral Pb-Pb collisions at $\sqrt{s_{\rm NN}}$ = 2.76 TeV

The ALICE collaboration has made the first measurement at the LHC of J/$\psi$ photoproduction in ultra-peripheral Pb-Pb collisions at $\sqrt{s_{\rm NN}}$ = 2.76 TeV. The J/$\psi$ is identified via its dimuon decay in the forward rapidity region with the muon spectrometer for events where the hadronic activity is required to be minimal. The analysis is based on an event sample corresponding to an integrated luminosity of about 55 $\mu$b$^{-1}$. The cross section for coherent J/$\psi$ production in the rapidity interval $-3.6 <~ y <~ -2.6$ is measured to be d$\sigma$/d$y = 1.00 \pm 0.18$ (stat) $+0.24/-0.26$ (syst) mb. The result is compared to theoretical models for coherent J/$\psi$ production and found to be in good agreement with models which include nuclear gluon shadowing.


Phys. Lett. B 718 (2013) 1273-1283
e-Print: arXiv:1209.3715 | PDF | inSPIRE
CERN-PH-EP-2012-270

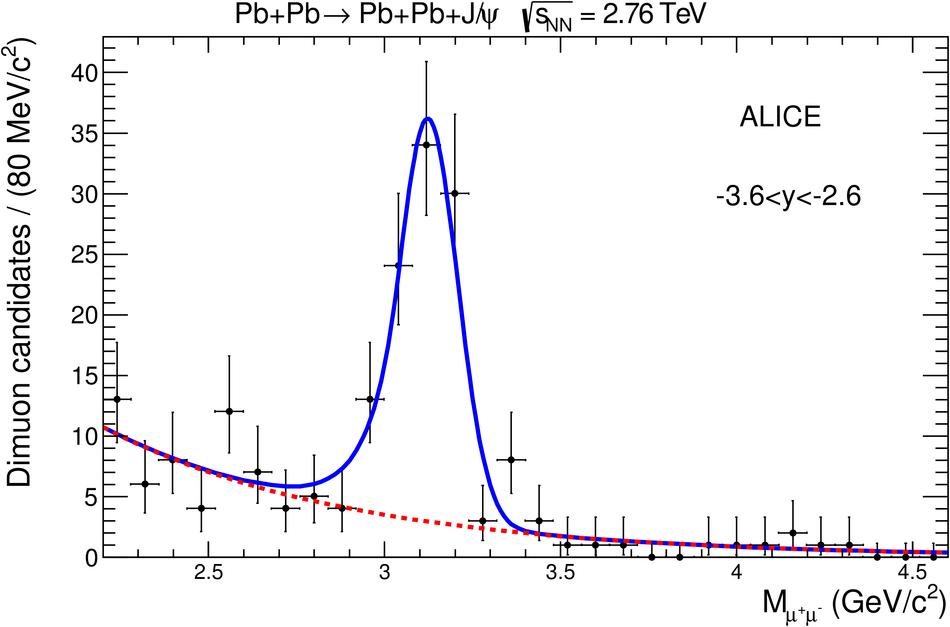
Figure 1

Invariant mass distribution for events with exactly two oppositely charged muons satisfying the event selection described in the text.

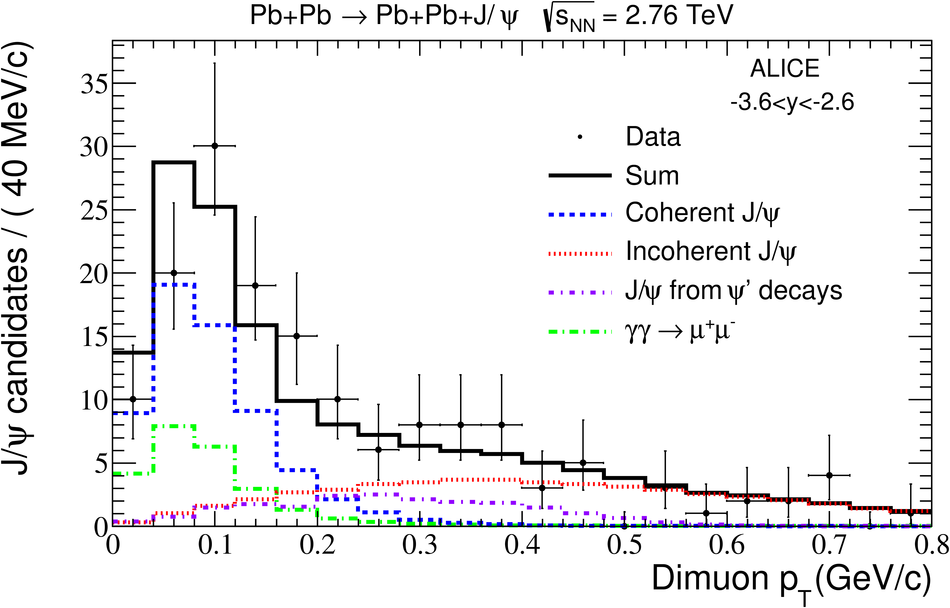
Figure 2

Dimuon $\pt$ distribution for events satisfying the event selection described inthe text. The data points are fitted summing four different Monte Carlo templates: coherent \jpsi production(dashed - blue), incoherent J/$\psi$ production (dotted - red), J/$\psi$s from $\psi^{'}$ decay(dash-dotted - violet), and $\gamma \gamma \rightarrow \mu^+ \mu^-$ (dash-dotted - green). The solid histogram (black) is the sum.

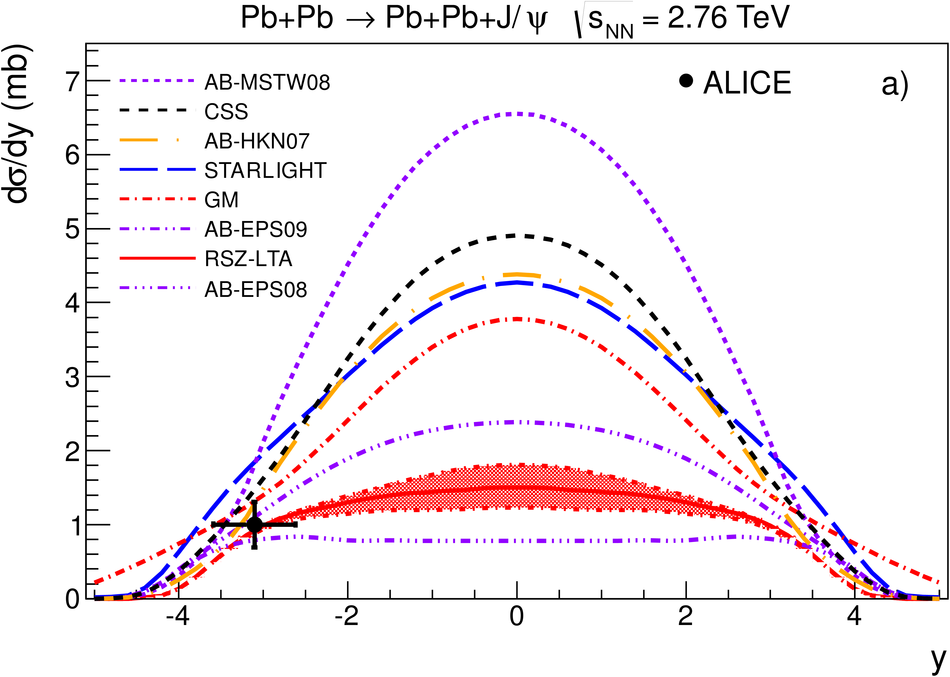
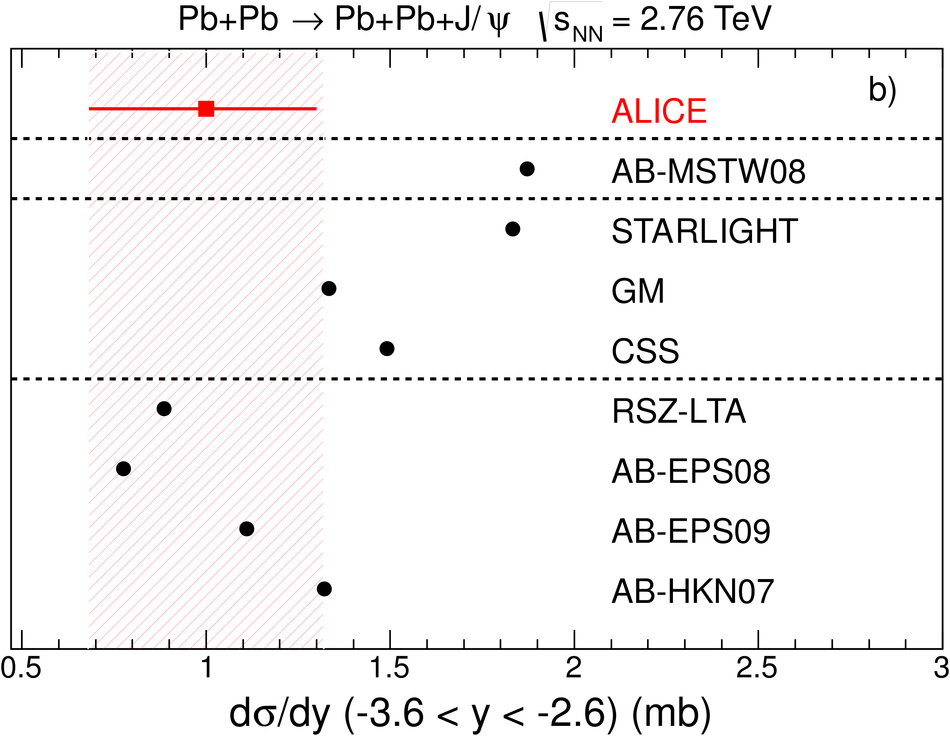
Figure 3

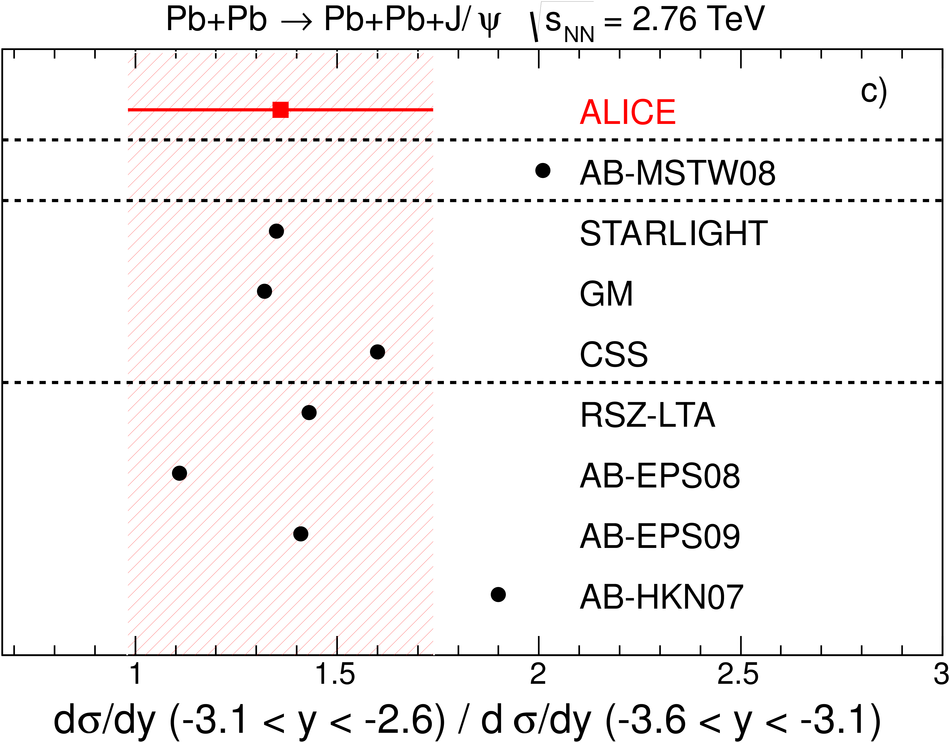
Measured coherent differential cross section of J/$\psi$ photoproduction inultra-peripheral Pb-Pb collisions at $\sqrt{s_{\mathrm{NN}} } = 2.76$ TeV. The error is the quadratic sum of the statistical and systematic errors. The theoretical calculations described in the text are also shown. The rapidity distributions are shown in a), b) shows the cross section integrated over -3.6 $< y < $ -2.6, and c) shows the ratio of the cross sections in the rapidity intervals -3.1 $< y < $ -2.6 and -3.6 $< y < $ -3.1 The dashed lines in the lower two plots indicate the three model categories discussed in the text.