The ratio of individual spectra to the combined spectrum as a function of $p_{\rm T}$ for pions (left), kaons (middle), and protons (right). From top-to-bottom the rows show the V0A multiplicity class 0-5%, 20-40% and 60-80%. Statistical and uncorrelated systematic uncertainties are shown as vertical error bars and error bands, respectively. Only the $p_{\rm T}$ ranges where individual analysis overlap are shown. See the text for further details. | 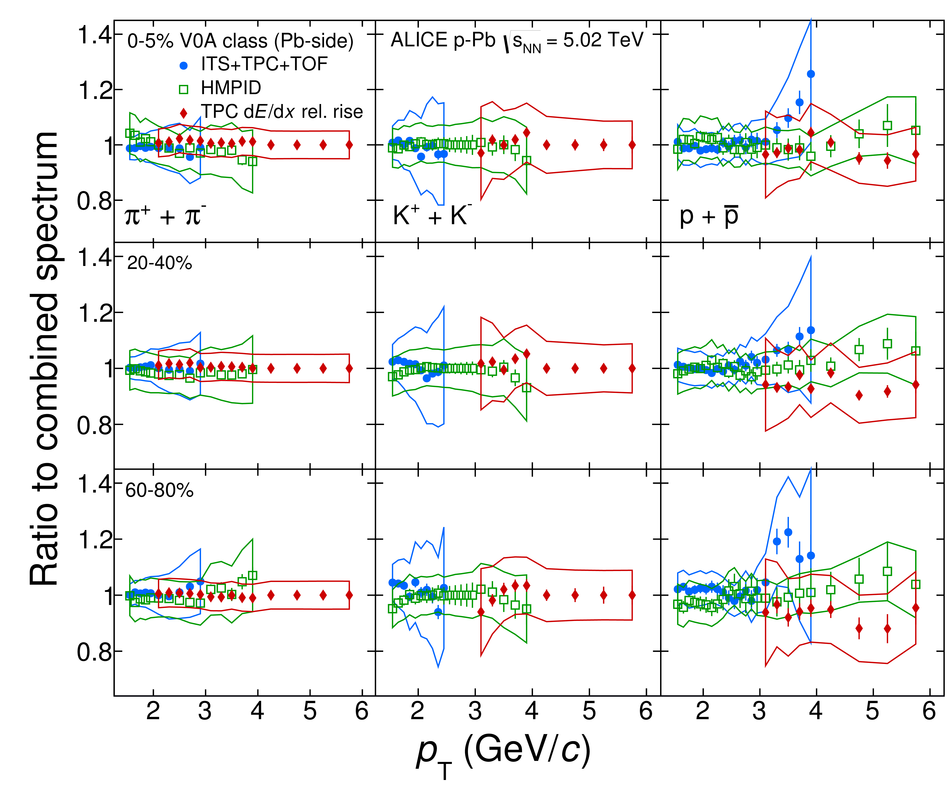 |