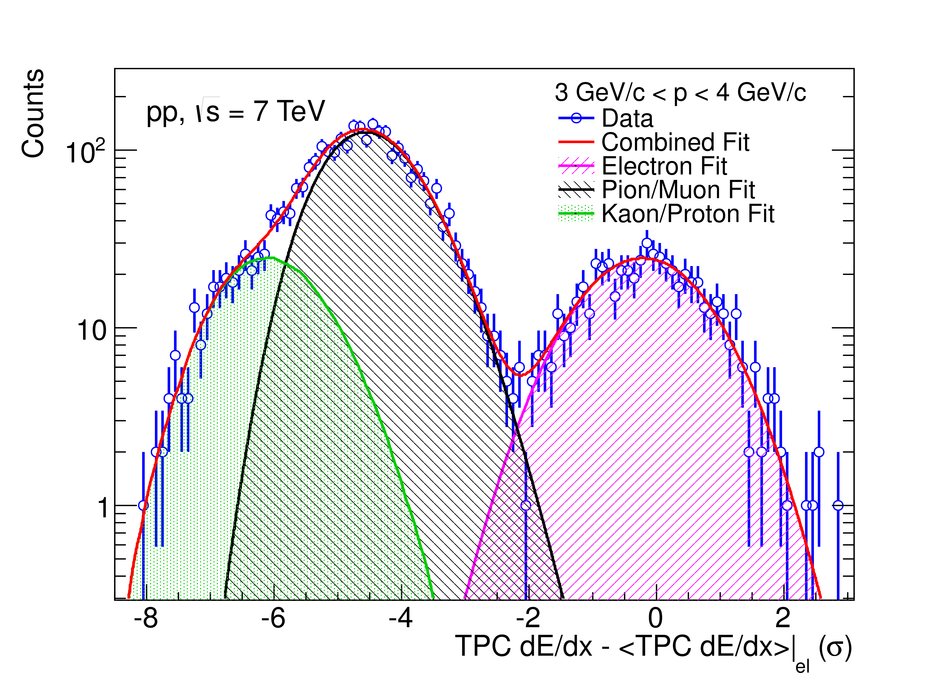
The specific energy loss distribution measured with the TPC in the momentum range $3 < p < 4$ GeV/c (histogram) is compared to the sum of functions describing the contributions from different particle species. Data and fit agree within statistical uncertainties. |