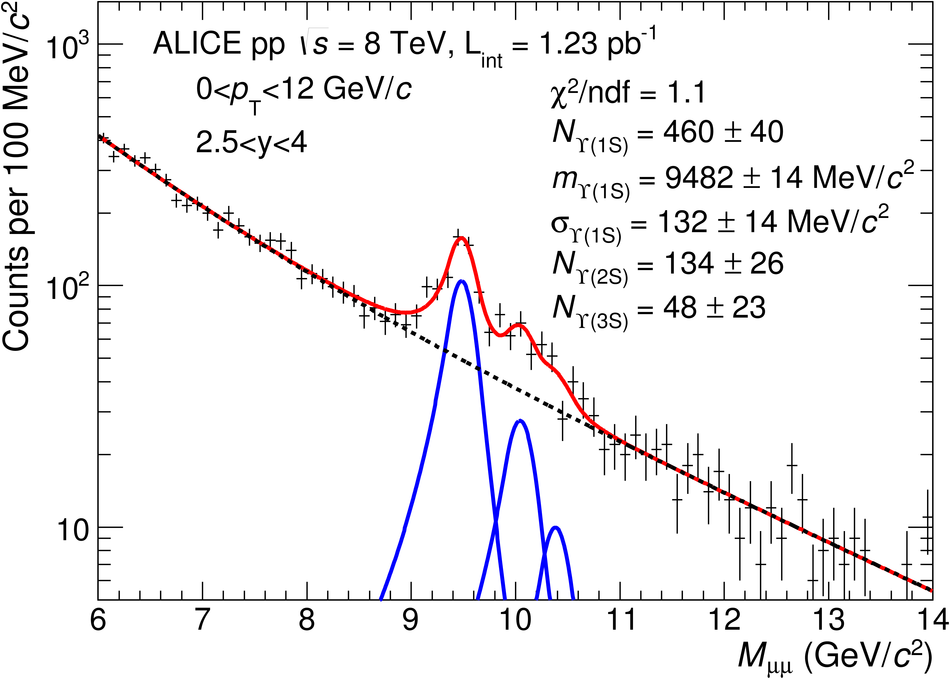
Dimuon invariant mass distributions in the region of charmonia (left) and bottomonia (right). Dashed lines correspond to the background. Solid lines correspond to either the signal functions, or the sum of all signal and background functions. In the charmonia region, the sum of two extended Crystal Ball functions is used for the signal and a pseudo-Gaussian function is used for the background. In the bottomonia region, the sum of three extended Crystal Ball functions is used for the signal and the sum of two exponential functions is used for the background. | 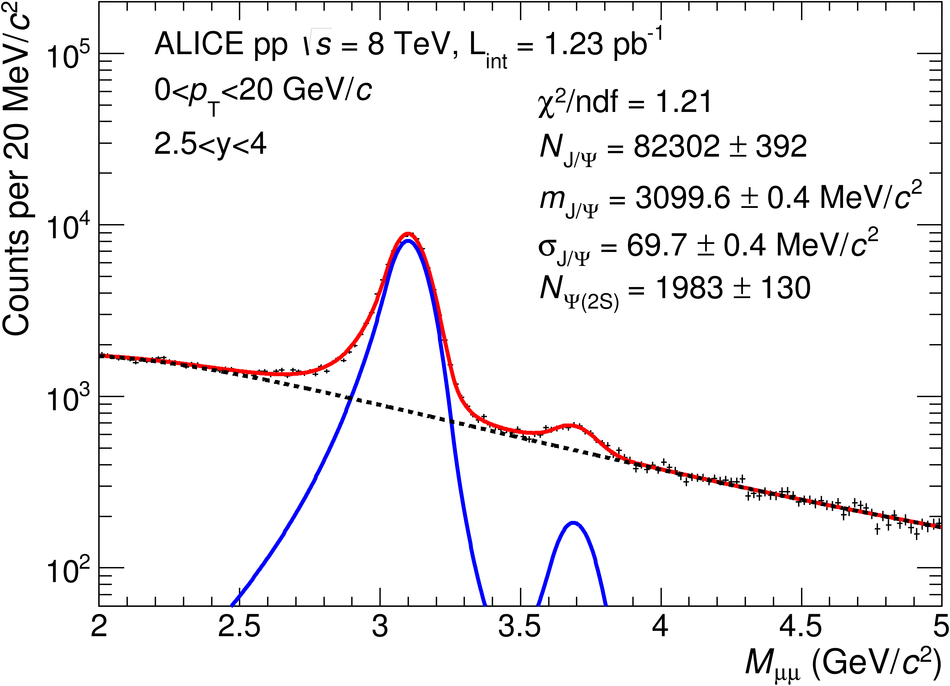 |