Charged kaon to charged pion ratio as a function of transverse momentum (solid markers). The upper figure shows the full $\pt$-range with the pp results (open markers) overlaid in the most central and the most peripheral centrality class. In the lower figure the $\pbpb$ results for $\pt < 8 \gevc$ are compared with EPOS model 2.17-3 (line). The systematic and statistical error are plotted as color boxes and vertical error bars, respectively. | 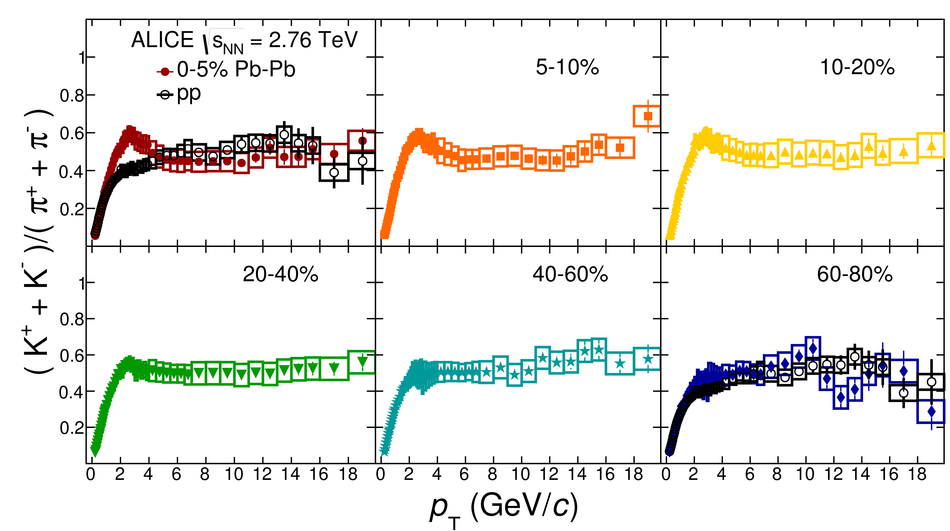 |
