Mean Cherenkov angle (upper panel) and standard deviation (lower panel) values for pions, kaons, and protons obtained by the three-Gaussian fitting procedure as a function of $\pt$ for 0-5% and 40-50% centrality $\pbpb$ collisions. The data points from the two different centrality classes overlap such that the difference is smaller than the size of the symbols used. | 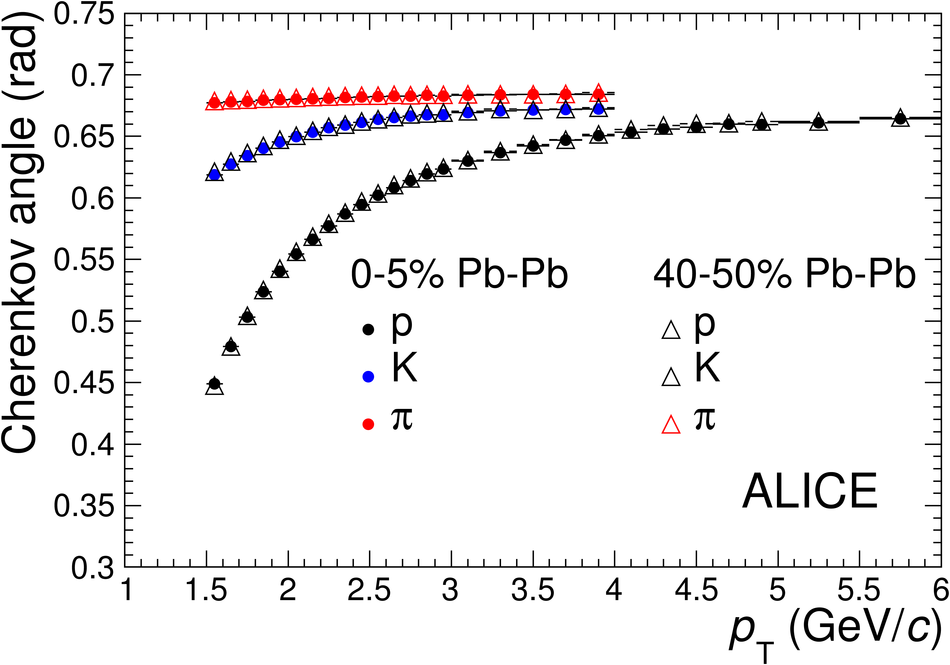 |
