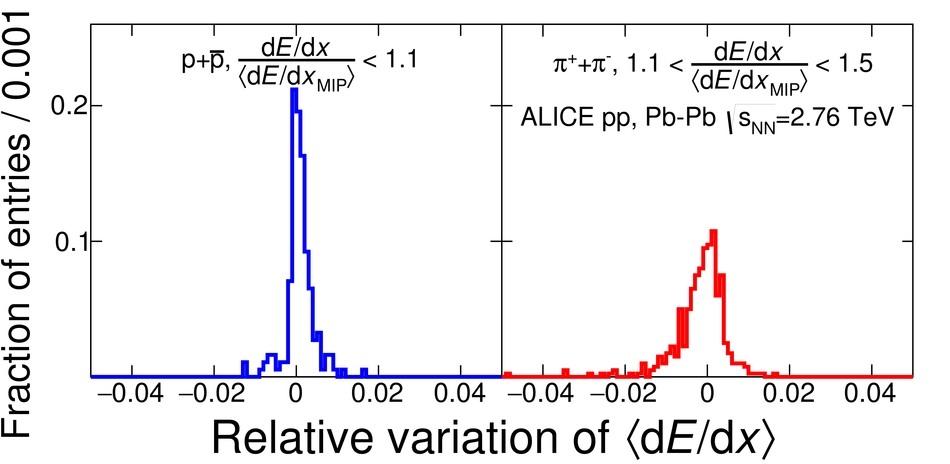
Upper figure: Relative variation of the width parameterizations with respect to the measured values in different $\dedx / \langle \dedx_{\rm MIP} \rangle$ intervals. Lower figure: Relative variation of the Bethe-Bloch $\mdedx$ parameterization with respect to the measured values in different $\dedx / \langle \dedx_{\rm MIP} \rangle$ intervals. The distributions were constructed using all the available data, six centrality classes and pp collisions with four sub-samples ($|\eta|$ intervals) each. | 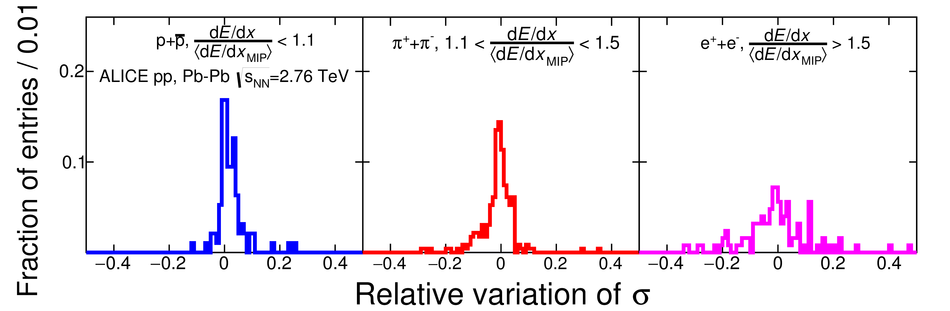 |