The $\dedx$ as a function of $\eta$ for electrons on the Fermi Plateau (upper panel) and MIP pions (middle panel); the selection criteria are described in the text. The solid round markers indicate the average, $\mdedx$, and the height of the boxes is given by the standard deviation, $\sigma$. The lower panel shows the ratio between the Plateau and MIP $\mdedx$. The statistical uncertainty is smaller than the marker sizes. These results were obtained for pp collisions at $\sqrt{s}=$2.76 TeV. | 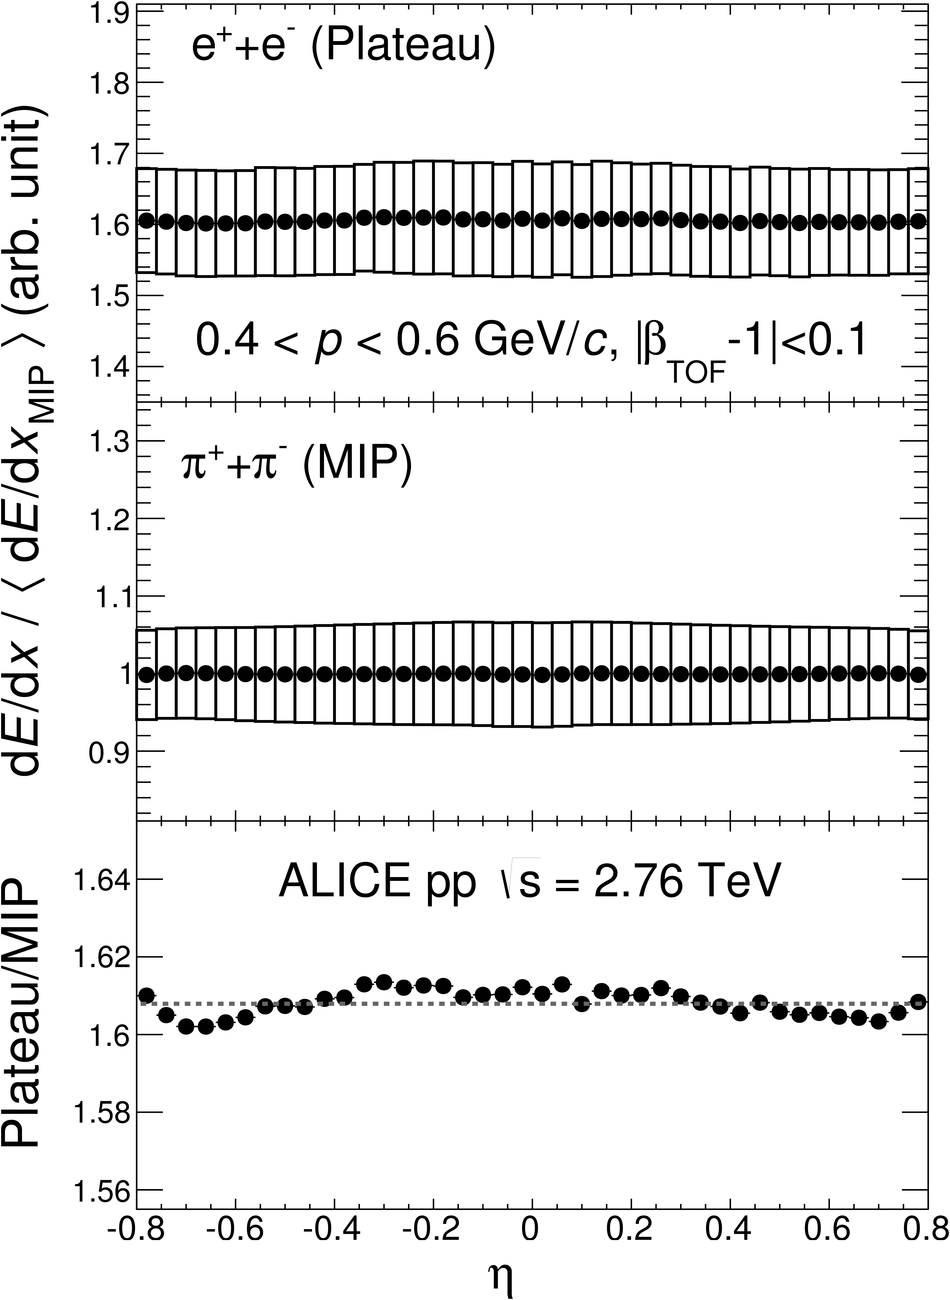 |