The charged--particle pseudorapidity density distributions scaled by the average number of participants in
various pseudorapidity intervals as a function of the number of participants. The four right-most points (open symbols) in each
$\eta$ range, as well as the mid-rapidity points (circles) are from previously published results [6,17].
The uncertainties on $\left\langle N_{\rm{part}}\right\rangle$ from the Glauber calculations are only included on the points at
mid-rapidity. Thus, the uncertainty band around the mid-rapidity points reflect both the measurement uncertainties and the
uncertainty on $\left\langle N_{\rm{part}}\right\rangle$, while other $\eta$ ranges only show the measurement uncertainties. The
lower part shows the ratio of each distribution to the previously published distributions for $|\eta|< 0.5$. | 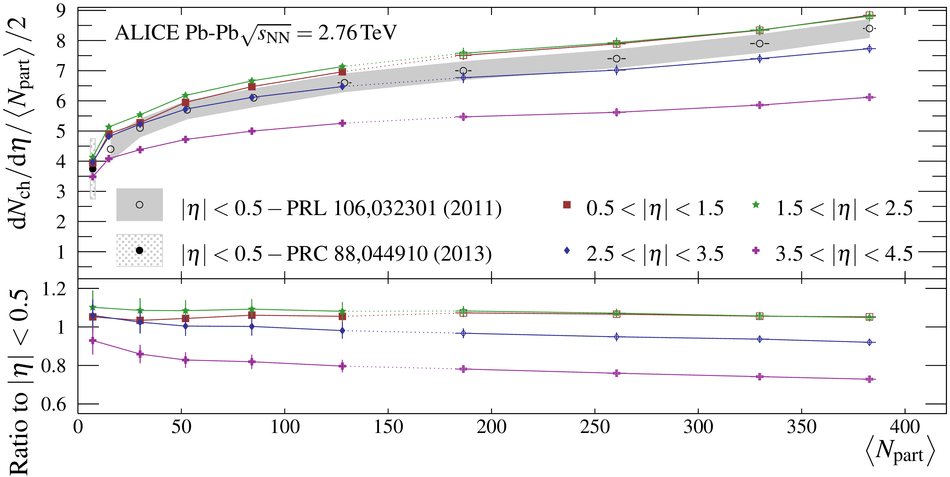 |