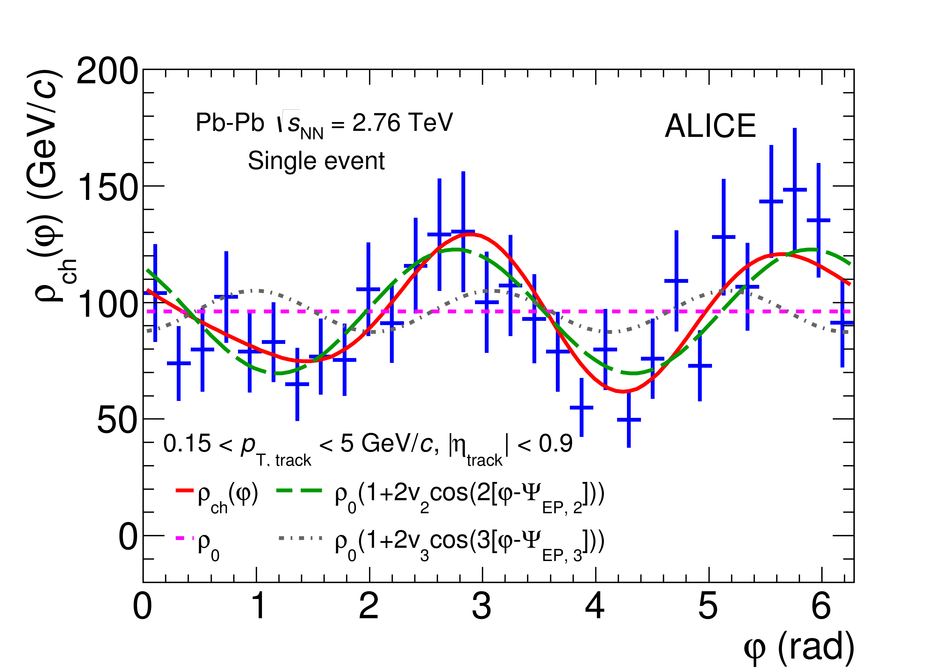
Transverse momentum density of charged tracks as a function of azimuthal angle for a single event from the most central 0-5% event class. Data points (blue) are given with statistical uncertainties only. The red curve is the fit of Eq.[5] to the distribution, the green and gray curves, obtained from the fit of Eq.[5] as well, show the independent contributions of $v_2$ and $v_3$ to $\rho_{\rm ch}(\phi)$. The dashed magenta line is the normalization constant $\rho_0$.
|  |