The inclusive production of the $\psi$(2S) charmonium state was studied as a function of centrality in p-Pb collisions at the nucleon-nucleon center of mass energy $\sqrt{s_{\rm NN}}$ = 5.02 TeV at the CERN LHC. The measurement was performed with the ALICE detector in the center of mass rapidity ranges $-4.46<~y_{\rm cms}<~-2.96$ and $2.03<~y_{\rm cms}<~3.53$, down to zero transverse momentum, by reconstructing the $\psi$(2S) decay to a muon pair. The $\psi$(2S) production cross section $\sigma_{\psi(\rm 2S)}$ is presented as a function of the collision centrality, which is estimated through the energy deposited in forward rapidity calorimeters. The relative strength of nuclear effects on the $\psi$(2S) and on the corresponding 1S charmonium state J/$\psi$ is then studied by means of the double ratio of cross sections $[\sigma_{\psi(\rm 2S)}/\sigma_{\rm J/\psi}]_{\rm pPb}/[\sigma_{\psi(\rm 2S)}/\sigma_{\rm J/\psi}]_{\rm pp}$ between p-Pb and pp collisions, and by the values of the nuclear modification factors for the two charmonium states. The results show a large suppression of $\psi$(2S) production relative to the J/$\psi$ at backward (negative) rapidity, corresponding to the flight direction of the Pb-nucleus, while at forward (positive) rapidity the suppressions of the two states are comparable. Finally, comparisons to results from lower energy experiments and to available theoretical models are presented.
JHEP 06 (2016) 50
HEP Data
e-Print: arXiv:1603.02816 | PDF | inSPIRE
CERN-EP-2016-046
Figure 2
Left: $\psi$(2S) production cross sections shown as a function of $\langle N_{\rm coll}\rangle$ for both p-Pb and Pb-p collisions. Right: ${\rm B.R.}_{\psi(\rm 2S)\rightarrow\mu^+\mu^-}\sigma_{\psi(\rm 2S)}/{\rm B.R.}_{{\rm J}/\psi\rightarrow\mu^+\mu^-}\sigma_{{\rm J}/\psi}$ shown as a function of $\langle N_{\rm coll}\rangle$ and compared to the pp value (line), with a band representing its uncertainty In both figures, vertical error bars correspond to statistical uncertainties, while the open boxes represent the systematic uncertainties. The Pb-p points are slightly shifted in $\langle N_{\rm coll}\rangle$ to improve visibility. | 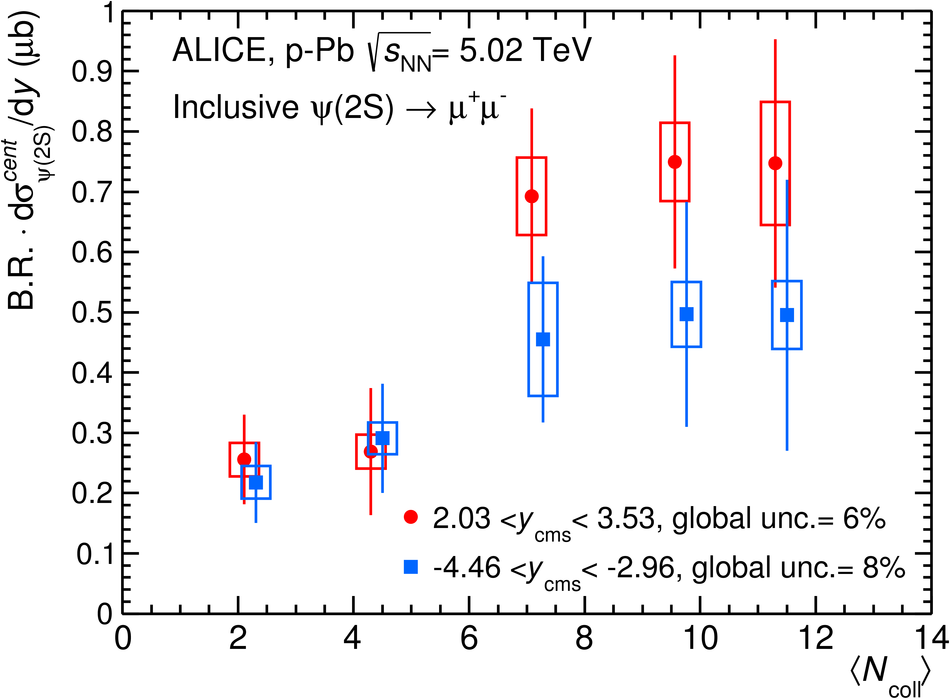 |
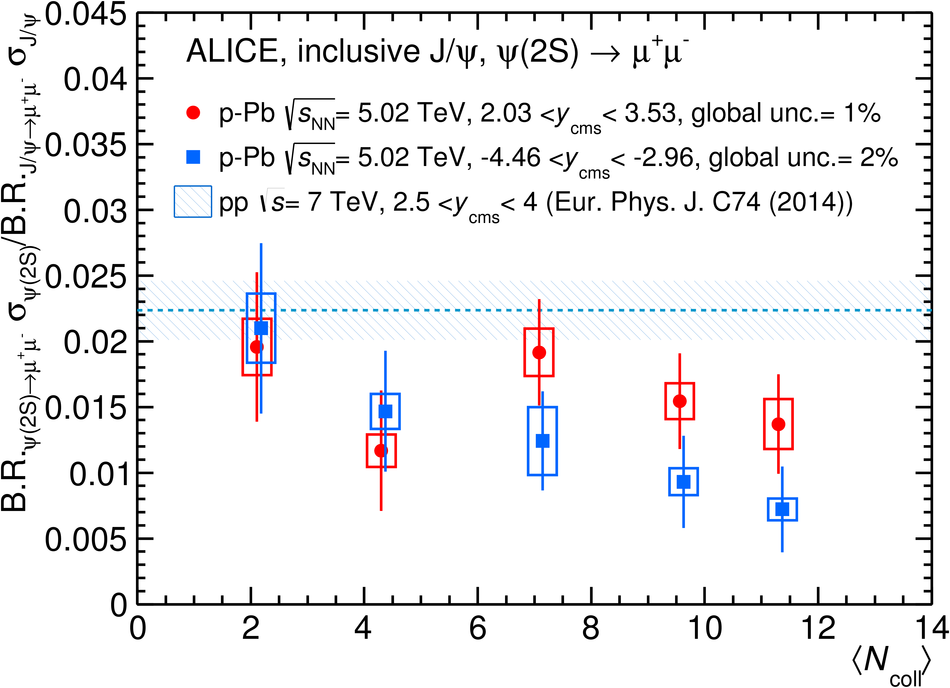
Figure 3
Double ratio $[\sigma_{\psi(\rm 2S)}/\sigma_{{\rm J}/\psi}]_{\rm pPb}/[\sigma_{\psi(\rm 2S)}/\sigma_{{\rm J}/\psi}]_{\rm pp}$ for p-Pb and Pb-p collisions, shown as a function of $\langle N_{\rm coll}\rangle$ (Pb-p points are slightly shifted in $\langle N_{\rm coll}\rangle$ to improve visibility). The data are compared to PHENIX mid-rapidity results and to the theoretical calculations of Ref.[11] and [26]. The boxes around unity correspond to the global systematic uncertainties at forward (red box) and backward (blue box) rapidities The grey box is a global systematic uncertainty common to both p-Pb rapidity ranges, while the green box refers to the PHENIX results. | 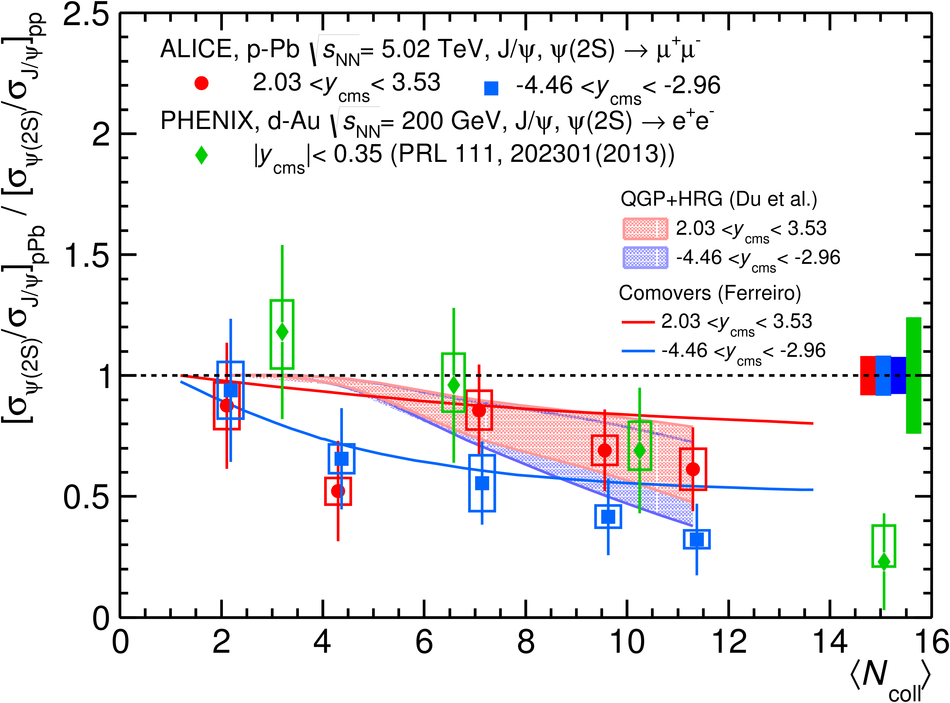 |
Figure 4
$\jpsi$ and $\psi$(2S) nuclear modification factors, $Q_{\rm pPb}$, shown as a function of $\langle N_{\rm coll}\rangle$ for the backward (left) and forward (right) rapidity regions and compared to theoretical models. The boxes around unity correspond to the global $\psi$(2S) systematic uncertainties at forward (red box) and backward (blue box) rapidities The grey box is a global systematic uncertainty common to both $\jpsi$ and $\psi$(2S). | 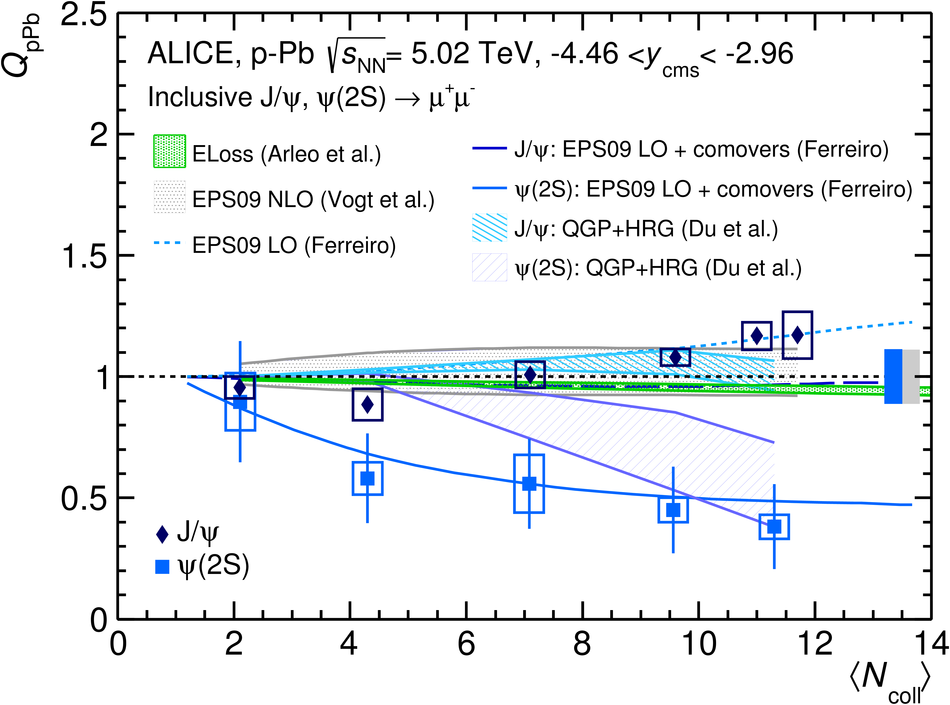 |
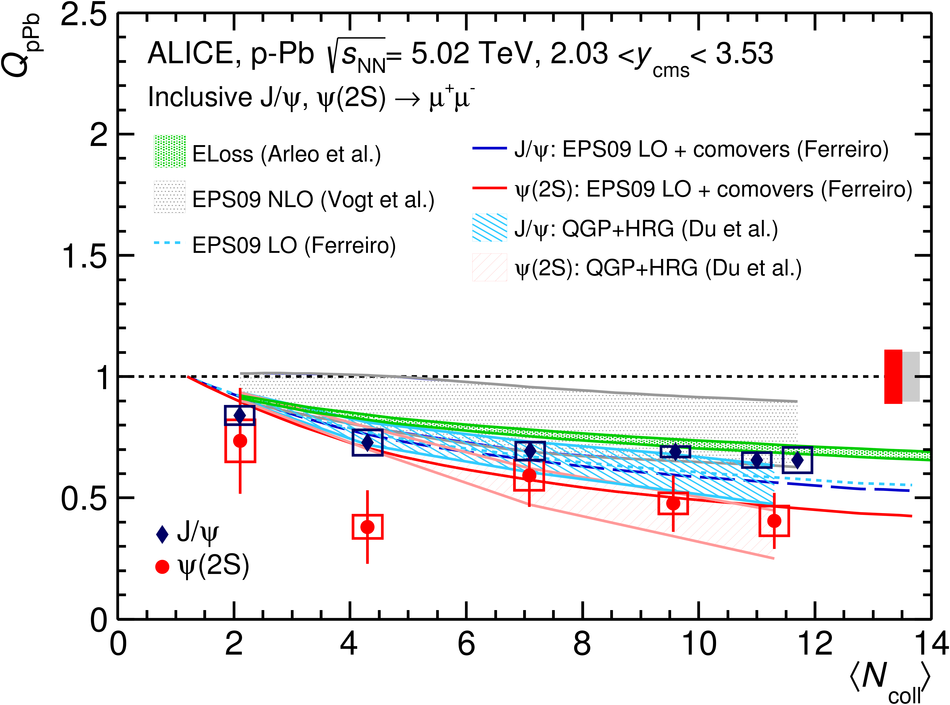
Figure 5
Double ratio $[\sigma_{\psi(\rm 2S)}/\sigma_{{\rm J}/\psi}]_{\rm pPb}/[\sigma_{\psi(\rm 2S)}/\sigma_{{\rm J}/\psi}]_{\rm pp}$ shown as a function of $\tau_c$ for the backward and forward rapidity regions. For each $y$-range, the two sets of points were obtained from the centrality analysis and from the $p_{\rm T}$-dependent analysis of Ref.[22]. Statistical uncertainties are shown as lines, while the total systematic uncertainties are shown as boxes around the points. The results of a corresponding analysis carried out on the PHENIX mid-rapidity data is also shown. The box around unity represents the PHENIX global systematic uncertainty. For the ALICE results, the global uncertainties are different for the various data sets, and are included in the boxes around the points. |  |