Inclusive beauty production cross section per rapidity unit measured at mid-rapidity as a function of center of mass energy in pp collisions (PHENIX and ALICE results) and p$\bar{\mathrm{p}}$ collisions (UA1 and CDF results) along with the the comparison to FONLL calculations. Error bars represent the statistical and systematic uncertainties added in quadrature. The FONLL calculation was performed for the five experimental rapidity ranges and center of mass energies shown in the figure, and these points are drawn as a curve. | 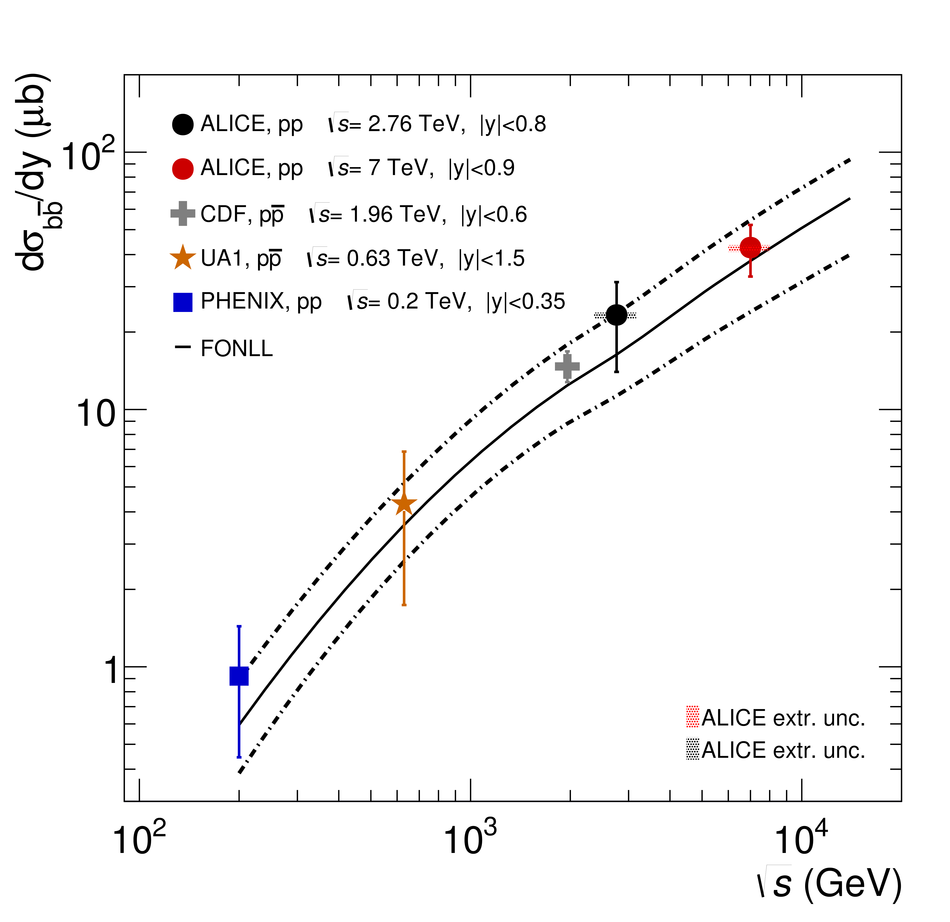 |