(a) $\pt$-differential inclusive production cross section of electrons from beauty hadron decays. The green dashed, red dotted, and blue dot-dashed lines represent the FONLL , $k_{\rm T}$-factorization , and GM-VFNS uncertainty range, respectively. (b)-(d) Ratios of the data and the central prediction of pQCD calculations for electrons from beauty hadron decays. For all panels, the error bars (boxes) represent the statistical (systematic) uncertainties | 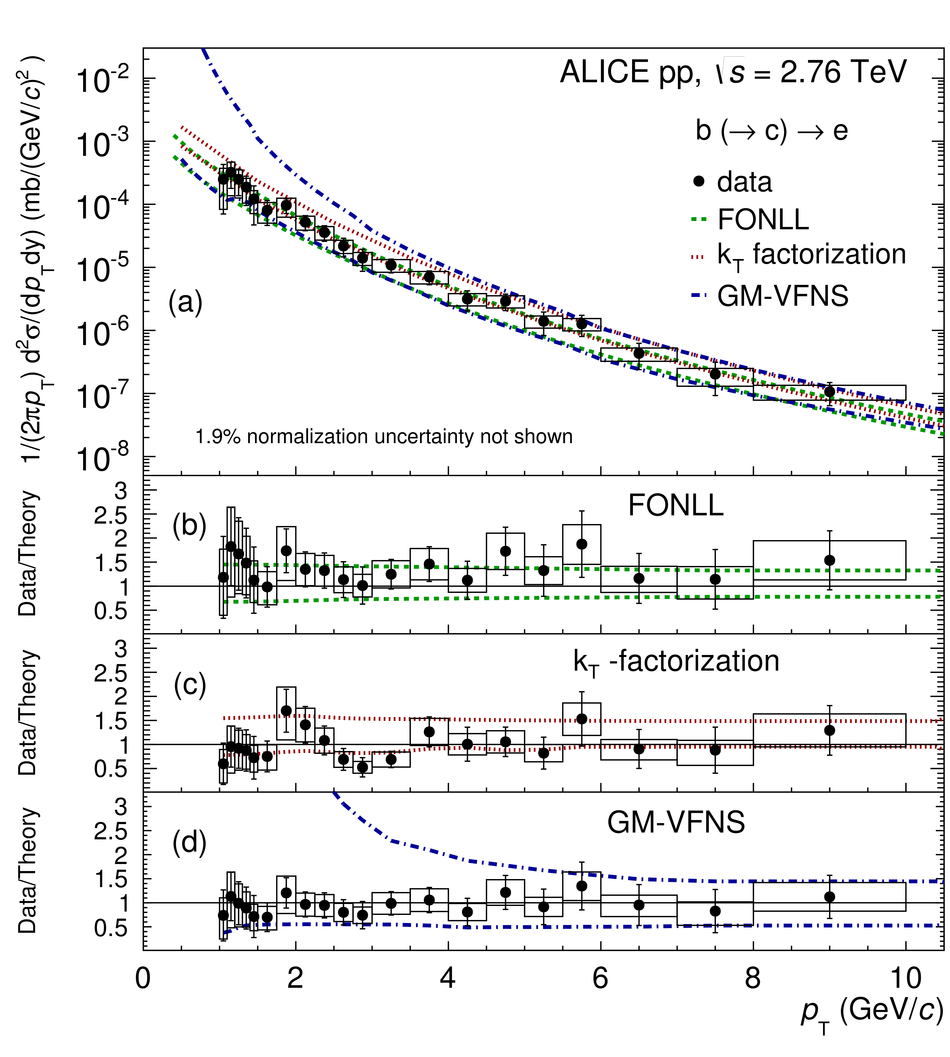 |