Suppression of $ψ$(2S) production in p-Pb collisions at $\sqrt{s_{\rm NN}}$ = 5.02 TeV

The ALICE Collaboration has studied the inclusive production of the charmonium state $\psi(2S)$ in proton-lead (p-Pb) collisions at the nucleon-nucleon centre of mass energy $\sqrt{s_{NN}}$ = 5.02 TeV at the CERN LHC. The measurement was performed at forward ($2.03< y_{cms}< 3.53$) and backward ($-4.46< y_{cms}< -2.96$) centre of mass rapidities, studying the decays into muon pairs. In this paper, we present the inclusive production cross sections $\sigma_{\psi(2S)}$, both integrated and as a function of the transverse momentum $p_{T}$, for the two $y_{cms}$ domains. The results are compared to those obtained for the 1S vector state (J/$\psi$), by showing the ratios between the production cross sections, as well as the double ratios $[\sigma_{\psi(2S)}/\sigma_{J/\psi}]_{pPb}/[\sigma_{\psi(2S)}/\sigma_{J/\psi}]_{pp}$ between p-Pb and proton-proton collisions. Finally, the nuclear modification factor for inclusive $\psi(2S)$ is evaluated and compared to the measurement of the same quantity for J/$\psi$ and to theoretical models including parton shadowing and coherent energy loss mechanisms. The results show a significantly larger suppression of the $\psi(2S)$ compared to that measured for J/$\psi$ and to models. These observations represent a clear indication for sizeable final state effects on $\psi(2S)$ production.


JHEP 12 (2014) 073
HEP Data
e-Print: arXiv:1405.3796 | PDF | inSPIRE
CERN-PH-EP-2014-092

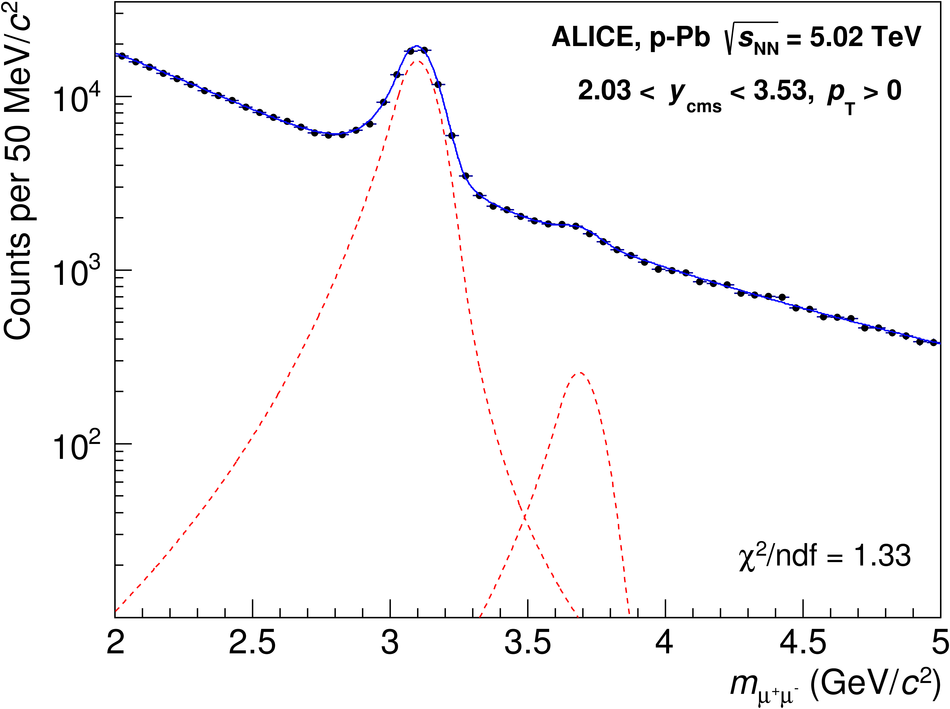
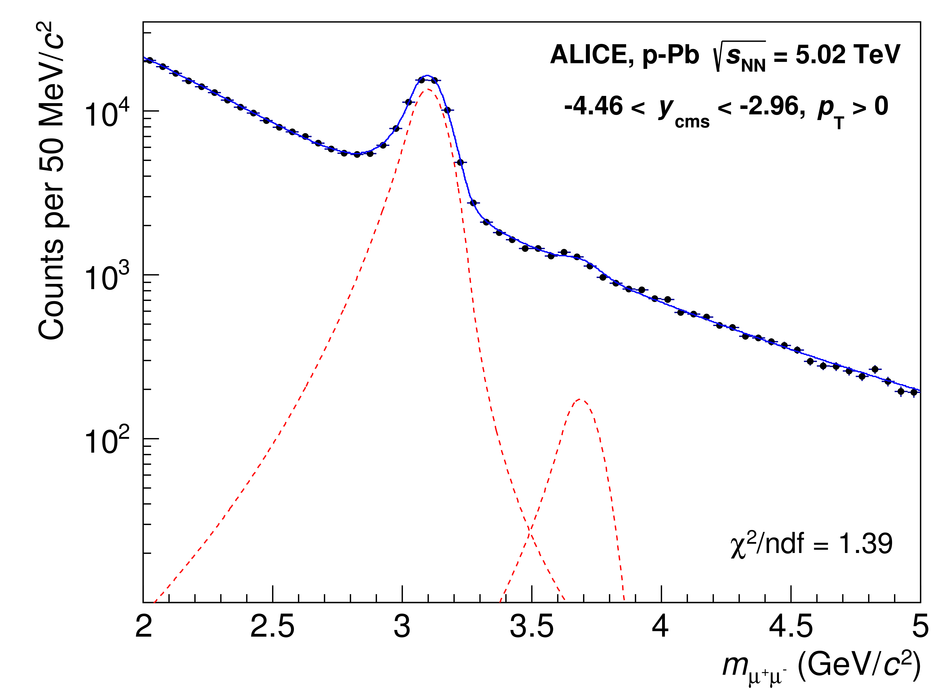
Figure 1

Opposite-sign dimuon invariant mass spectra for the p-Pb (top) and Pb-p (bottom) data samples, together with the result of a fit For the fits shown here, Crystal Ball functions (shown as dashed lines) and a variable-width Gaussian have been used for the resonances and the background,respectively. The $\chi^{2}$/ndf refers to the goodness of the signal and background combined fit in the displayed mass range.

Figure 2

The cross section ratios ${\rm B.R.}_{\psi(\rm 2S)\rightarrow\mu^+\mu^-}\sigma^{\psi(\rm 2S)}/{\rm B.R.}_{{\rm J}/\psi\rightarrow\mu^+\mu^-}\sigma^{{\rm J}/\psi}$ for p-Pb and Pb-p collisions,compared with the corresponding pp results at $\sqrt{s}=7$ TeV. The horizontal bars correspond to the width of the rapidity regions under study The vertical error bars represent statistical uncertainties, the boxes correspond to systematic uncertainties.

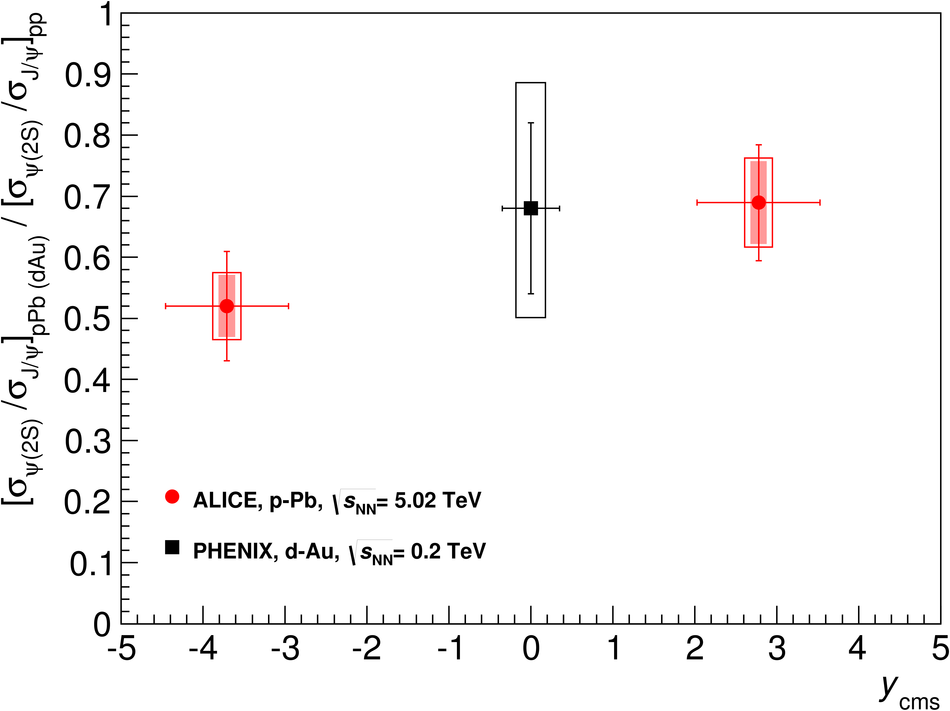
Figure 3

Double ratios $[\sigma_{\psi(\rm 2S)}/\sigma_{\rm J/\psi}]_{\rm pPb}/[\sigma_{\psi(\rm 2S)}/\sigma_{\rm J/\psi}]_{\rm pp}$ for p-Pb and Pb-p collisions,compared to the corresponding PHENIX result at $\sqrt{s_{\rm NN}}$ = 200 GeV. The horizontal bars correspond to the width of the rapidity regions under study. For ALICE, the vertical error bars correspond to statistical uncertainties, the boxes to uncorrelated systematic uncertainties, and the shaded areas to correlated uncertainties. For PHENIX, the various sources of systematic uncertainties were combined in quadrature.

Figure 4

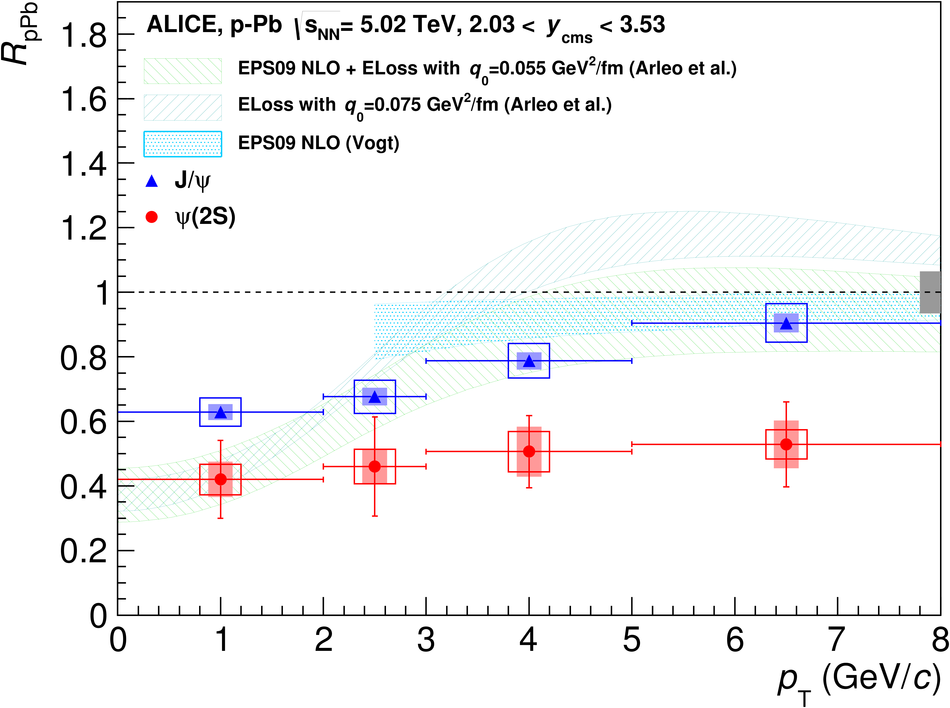
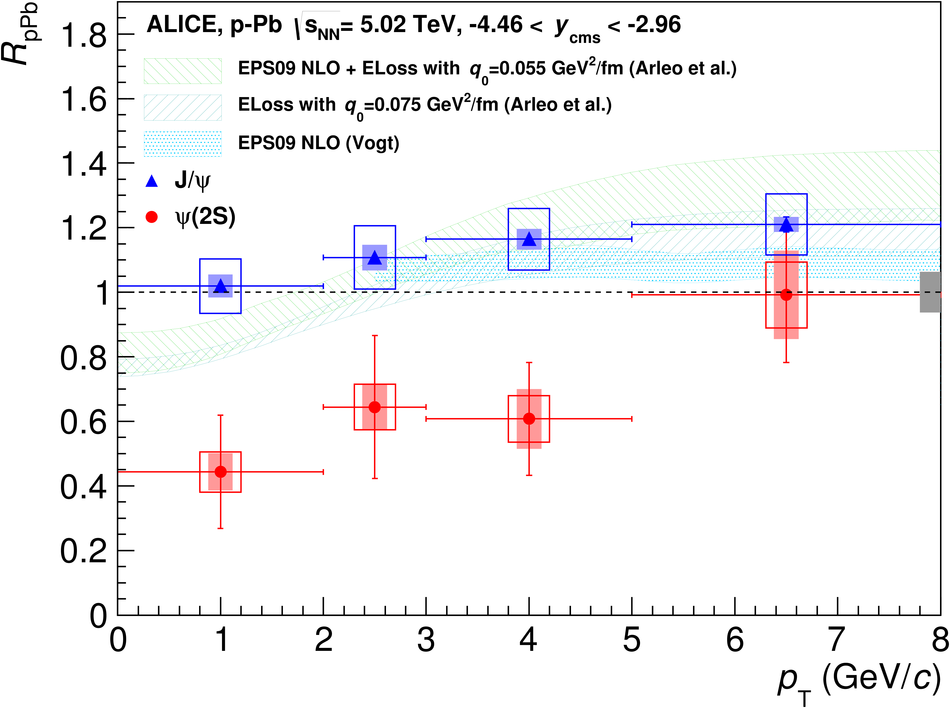
The nuclear modification factor for $\psi(\rm 2S)$, compared to the corresponding quantity for J/$\psi$. The horizontal bars correspond to the width of the rapidity regions under study The vertical error bars correspond to statistical uncertainties, the boxes to uncorrelated systematic uncertainties, and the shaded areas to partially correlated uncertainties The filled box on the right, centered on $R_{\rm pPb}=1$, shows uncertainties that are fully correlated between J/$\psi$ and $\psi(\rm 2S)$. Model calculations tuned on J/$\psi$, and including nuclear shadowing and coherent energy loss are also shown The corresponding calculations for $\psi(\rm 2S)$ produce identical values for the coherent energy loss mechanisms and a 2-3% larger result for nuclear shadowing and therefore are not shown.

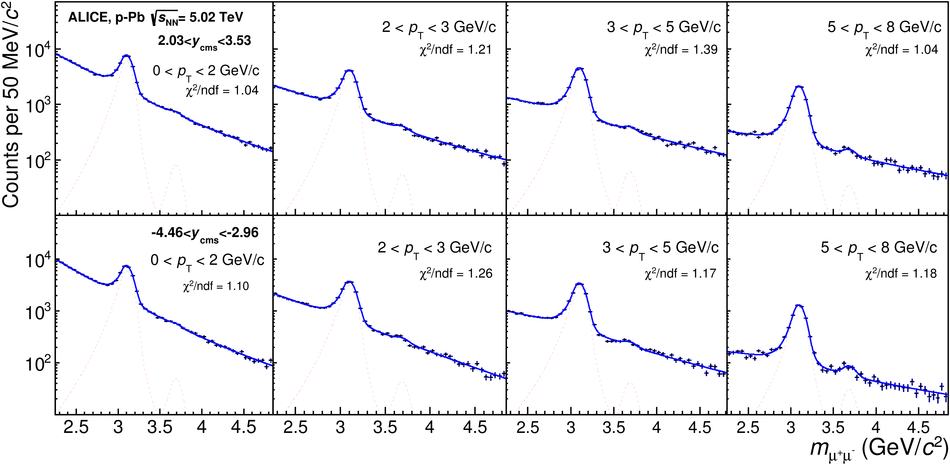
Figure 5

Opposite-sign dimuon invariant mass spectra, in bins of transverse momentum, for the p-Pband Pb-p data samples For the fits shown here, Crystal Ball functions (shown as dashed lines) and a variable-width Gaussian have been used for the resonances and the background, respectively The $\chi^{2}$/ndf refers to the goodness of the signal and background combined fit in the displayed mass range.

Figure 6

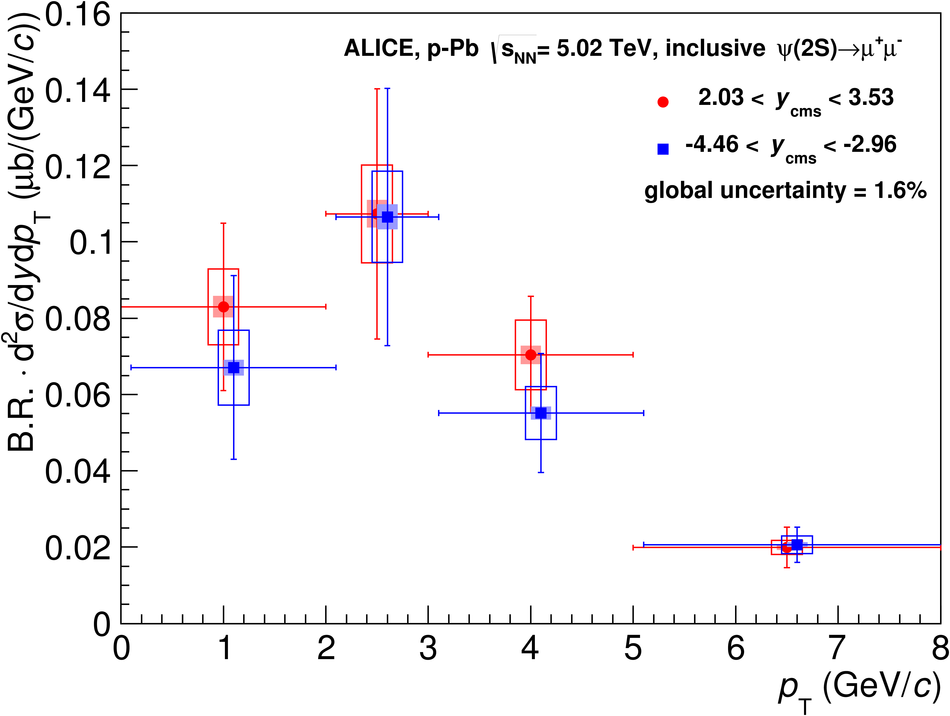
The $\psi(\rm 2S)$ differential cross sections B.R.$\cdot{\rm d}^2\sigma/{\rm d}y{\rm d}p_{\rm T}$ for p-Pband Pb-p collisions. The horizontal bars correspond to the width of the transverse momentum bins. Thevertical error bars correspond to the statistical uncertainties, the boxes to uncorrelated systematicuncertainties and the shaded areas to $p_{\rm T}$-correlated uncertainties. A global 1.6% uncertainty applies to both p-Pb and Pb-p results The points corresponding to negative $y$ are slightly shifted in $p_{\rm T}$ to improve visibility.

Figure 7

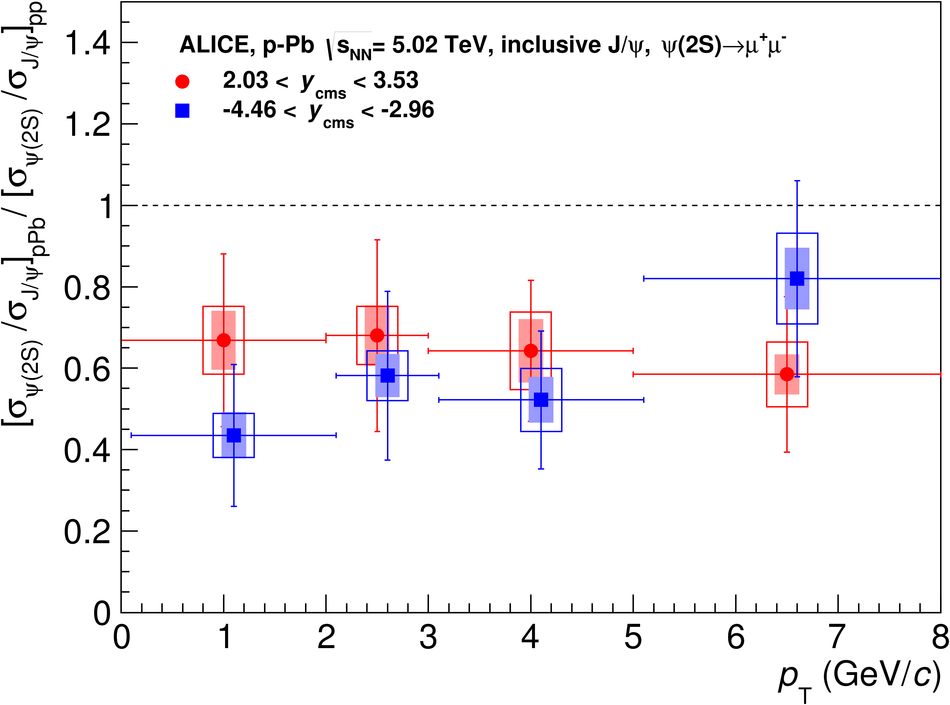
The double ratio $[\sigma_{\psi(\rm 2S)}/\sigma_{\rm J/\psi}]_{\rm pPb}/[\sigma_{\psi(\rm2S)}/\sigma_{\rm J/\psi}]_{\rm pp}$ for p-Pb and Pb-p collisions, as a function of $p_{\rm T}$. The horizontal bars correspond to the width of the transverse momentum bins. The vertical error barscorrespond to the statistical uncertainties, the boxes to uncorrelated systematic uncertainties and theshaded areas to correlated uncertainties. The points corresponding to negative $y$ are slightly shiftedin $p_{\rm T}$ to improve visibility.

Figure 8

The nuclear modification factor for $\psi(\rm 2S)$, compared to the corresponding quantity forJ/$\psi$, as a function of $p_{\rm T}$. Plots correspond to p-Pb (left) and Pb-p(right) collisions The horizontal bars correspond to the width of the transverse momentum bins The vertical error bars correspond to statistical uncertainties, the boxes to uncorrelated systematic uncertainties, and the shaded areas to partiallycorrelated uncertainties. The filled box on the right, centered at $R_{\rm pPb}=1$, shows uncertainties that are fully correlated between J/$\psi$ and $\psi(\rm 2S)$ For details on model comparisons, see the caption of Fig4.