Two-particle angular correlations between unidentified charged trigger and associated particles are measured by the ALICE detector in p-Pb collisions at a nucleon-nucleon centre-of-mass energy of 5.02 TeV. The transverse-momentum range 0.7 $ < p_{\rm{T}, assoc} < p_{\rm{T}, trig} <$ 5.0 GeV/$c$ is examined, to include correlations induced by jets originating from low momen\-tum-transfer scatterings (minijets). The correlations expressed as associated yield per trigger particle are obtained in the pseudorapidity range $|\eta|<0.9$. The near-side long-range pseudorapidity correlations observed in high-multiplicity p-Pb collisions are subtracted from both near-side short-range and away-side correlations in order to remove the non-jet-like components. The yields in the jet-like peaks are found to be invariant with event multiplicity with the exception of events with low multiplicity. This invariance is consistent with the particles being produced via the incoherent fragmentation of multiple parton--parton scatterings, while the yield related to the previously observed ridge structures is not jet-related. The number of uncorrelated sources of particle production is found to increase linearly with multiplicity, suggesting no saturation of the number of multi-parton interactions even in the highest multiplicity p-Pb collisions. Further, the number scales in the intermediate multiplicity region with the number of binary nucleon-nucleon collisions estimated with a Glauber Monte-Carlo simulation.
Phys. Lett. B 741 (2015) 38-50
HEP Data
e-Print: arXiv:1406.5463 | PDF | inSPIRE
CERN-PH-EP-2014-084
Figure 1
Per-trigger yield as a function of $\Dphi$ with $0.7< p_{\rm T,assoc} < p_{\rm T,trig} < $ 5 GeV/$c$ in the 0-5% event class (left) and 95-100% event class (right). The distributions show the correlations before subtraction (blue circles), the long-range correlations (black triangles) scaled according to the $\Deta$ region in which they are integrated, the symmetrized near-side long-range correlations (green squares) and the correlations after long-range correlations (LRC) subtraction (red diamonds). The vertical arrows indicate the integration regions while the curve in the bottom left panel shows the magnitude of the third Fourier component on the away side. Statistical uncertainties are shown but are smaller than the symbol size |  |
Figure 2
Near-side (left panel) and away-side (right panel) per-trigger yields after long-range correlations subtraction as a function of V0A multiplicity class for several \pt cuts for trigger and associated particles: 0.7-5.0 GeV/$c$ (red triangles), 0.7-5.0 GeV/$c$ for $p_{\rm T,assoc}$ and 2-5 GeV/$c$ for $p_{\rm T,trig}$ (blue circles) as well as 2-5 GeV/$c$ (black circles). Statistical (lines) and systematic uncertainties (boxes) are shown, even though the statistical ones are mostly smaller than the symbol size |  |
Figure 3
Near-side (left panel) and away-side (right panel) per-trigger yields after long-range correlations subtraction as a function of the midrapidity charged particle multiplicity for the V0A (red circles), CL1 (blue squares) and ZNA (black triangles) multiplicity estimators. Statistical (lines) and systematic uncertainties (boxes) are shown, even though the statistical ones are smaller than the symbol size | 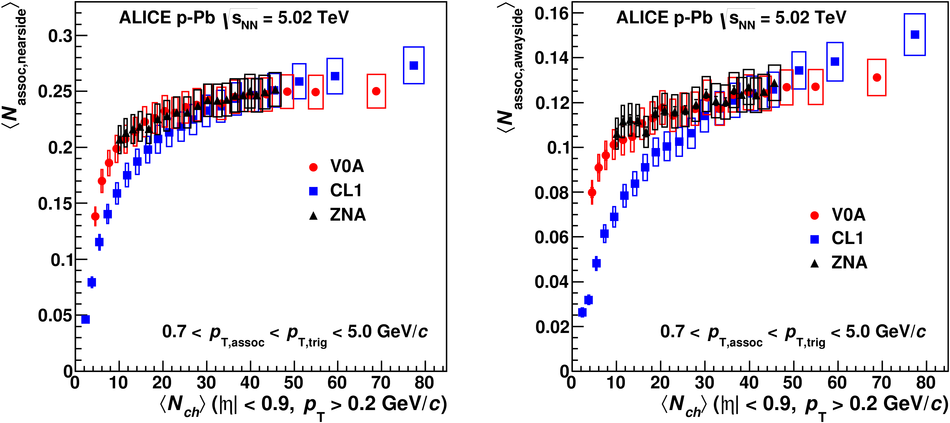 |
Figure 4
Near-side (left panel) and away-side (right panel) per-trigger yields as a function of V0A multiplicity class with (red circles) and without (black squares) subtraction of the long-range correlations. Statistical (lines) and systematic uncertainties (boxes) are shown, even though the statistical ones are mostly smaller than the symbol size | 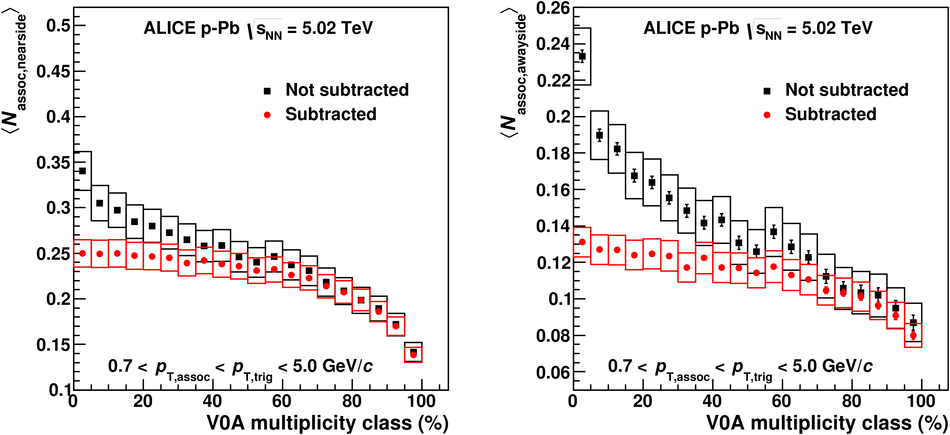 |
Figure 5
Top panel: number of uncorrelated seeds as a function of the midrapidity charged particle multiplicity. Shown are results for two $\pt$ cuts: 0.7 GeV/$c$ $< p_{\rm T,assoc} < p_{\rm T,trig} < $ 5.0 GeV/$c$ (red circles) and 2.0 GeV/$c$ $< p_{\rm T,assoc} < p_{\rm T,trig} < $ 5.0 GeV/$c$ (black squares). Each of them is fit with a linear function in the 0-50% multiplicity classes; open symbols are not included in the fit. Statistical (lines) and systematic uncertainties (boxes) are shown, even though the statistical ones are smaller than the symbol size Bottom panel: ratio between the number of uncorrelated seeds and the linear fit functions. Black points are displaced slightly for better visibility. | 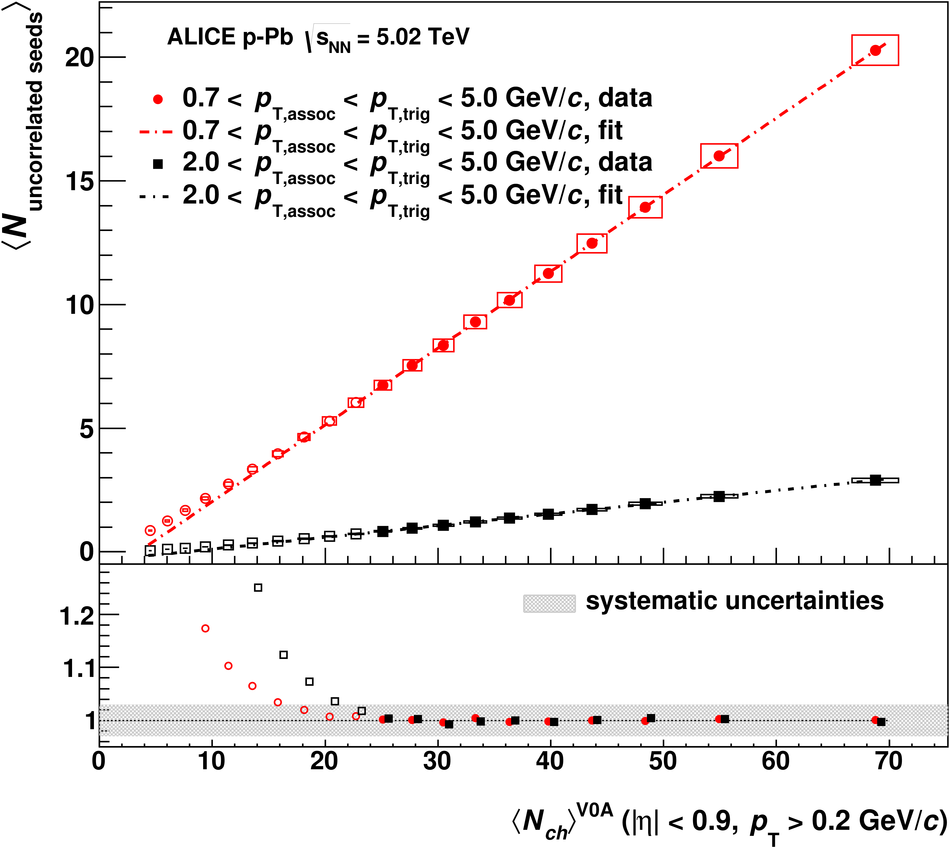 |
Figure 6
Ratio between uncorrelated seeds and $N_{\rm coll}$ estimated within the Glauber model as a function of V0A multiplicity class. Statistical (lines) and systematic uncertainties (boxes) are shown, even though the statistical ones are smaller than the symbol size. To aid the comparison, the higher $\pt$ range has been scaled by a factor 8.3 to agree with the lower $\pt$ range in the 50-55% multiplicity class | 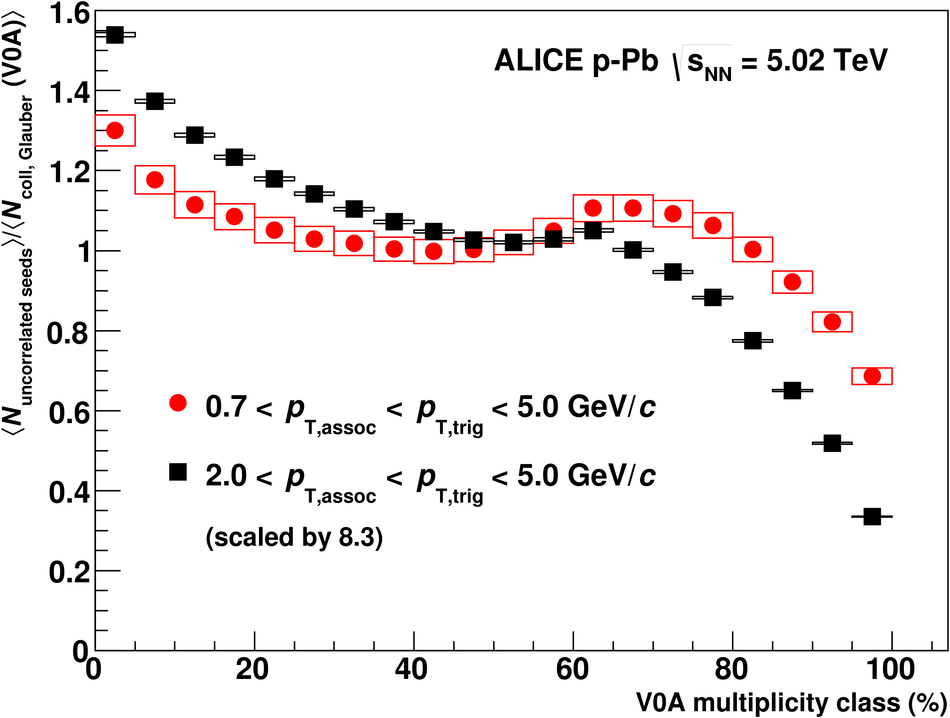 |