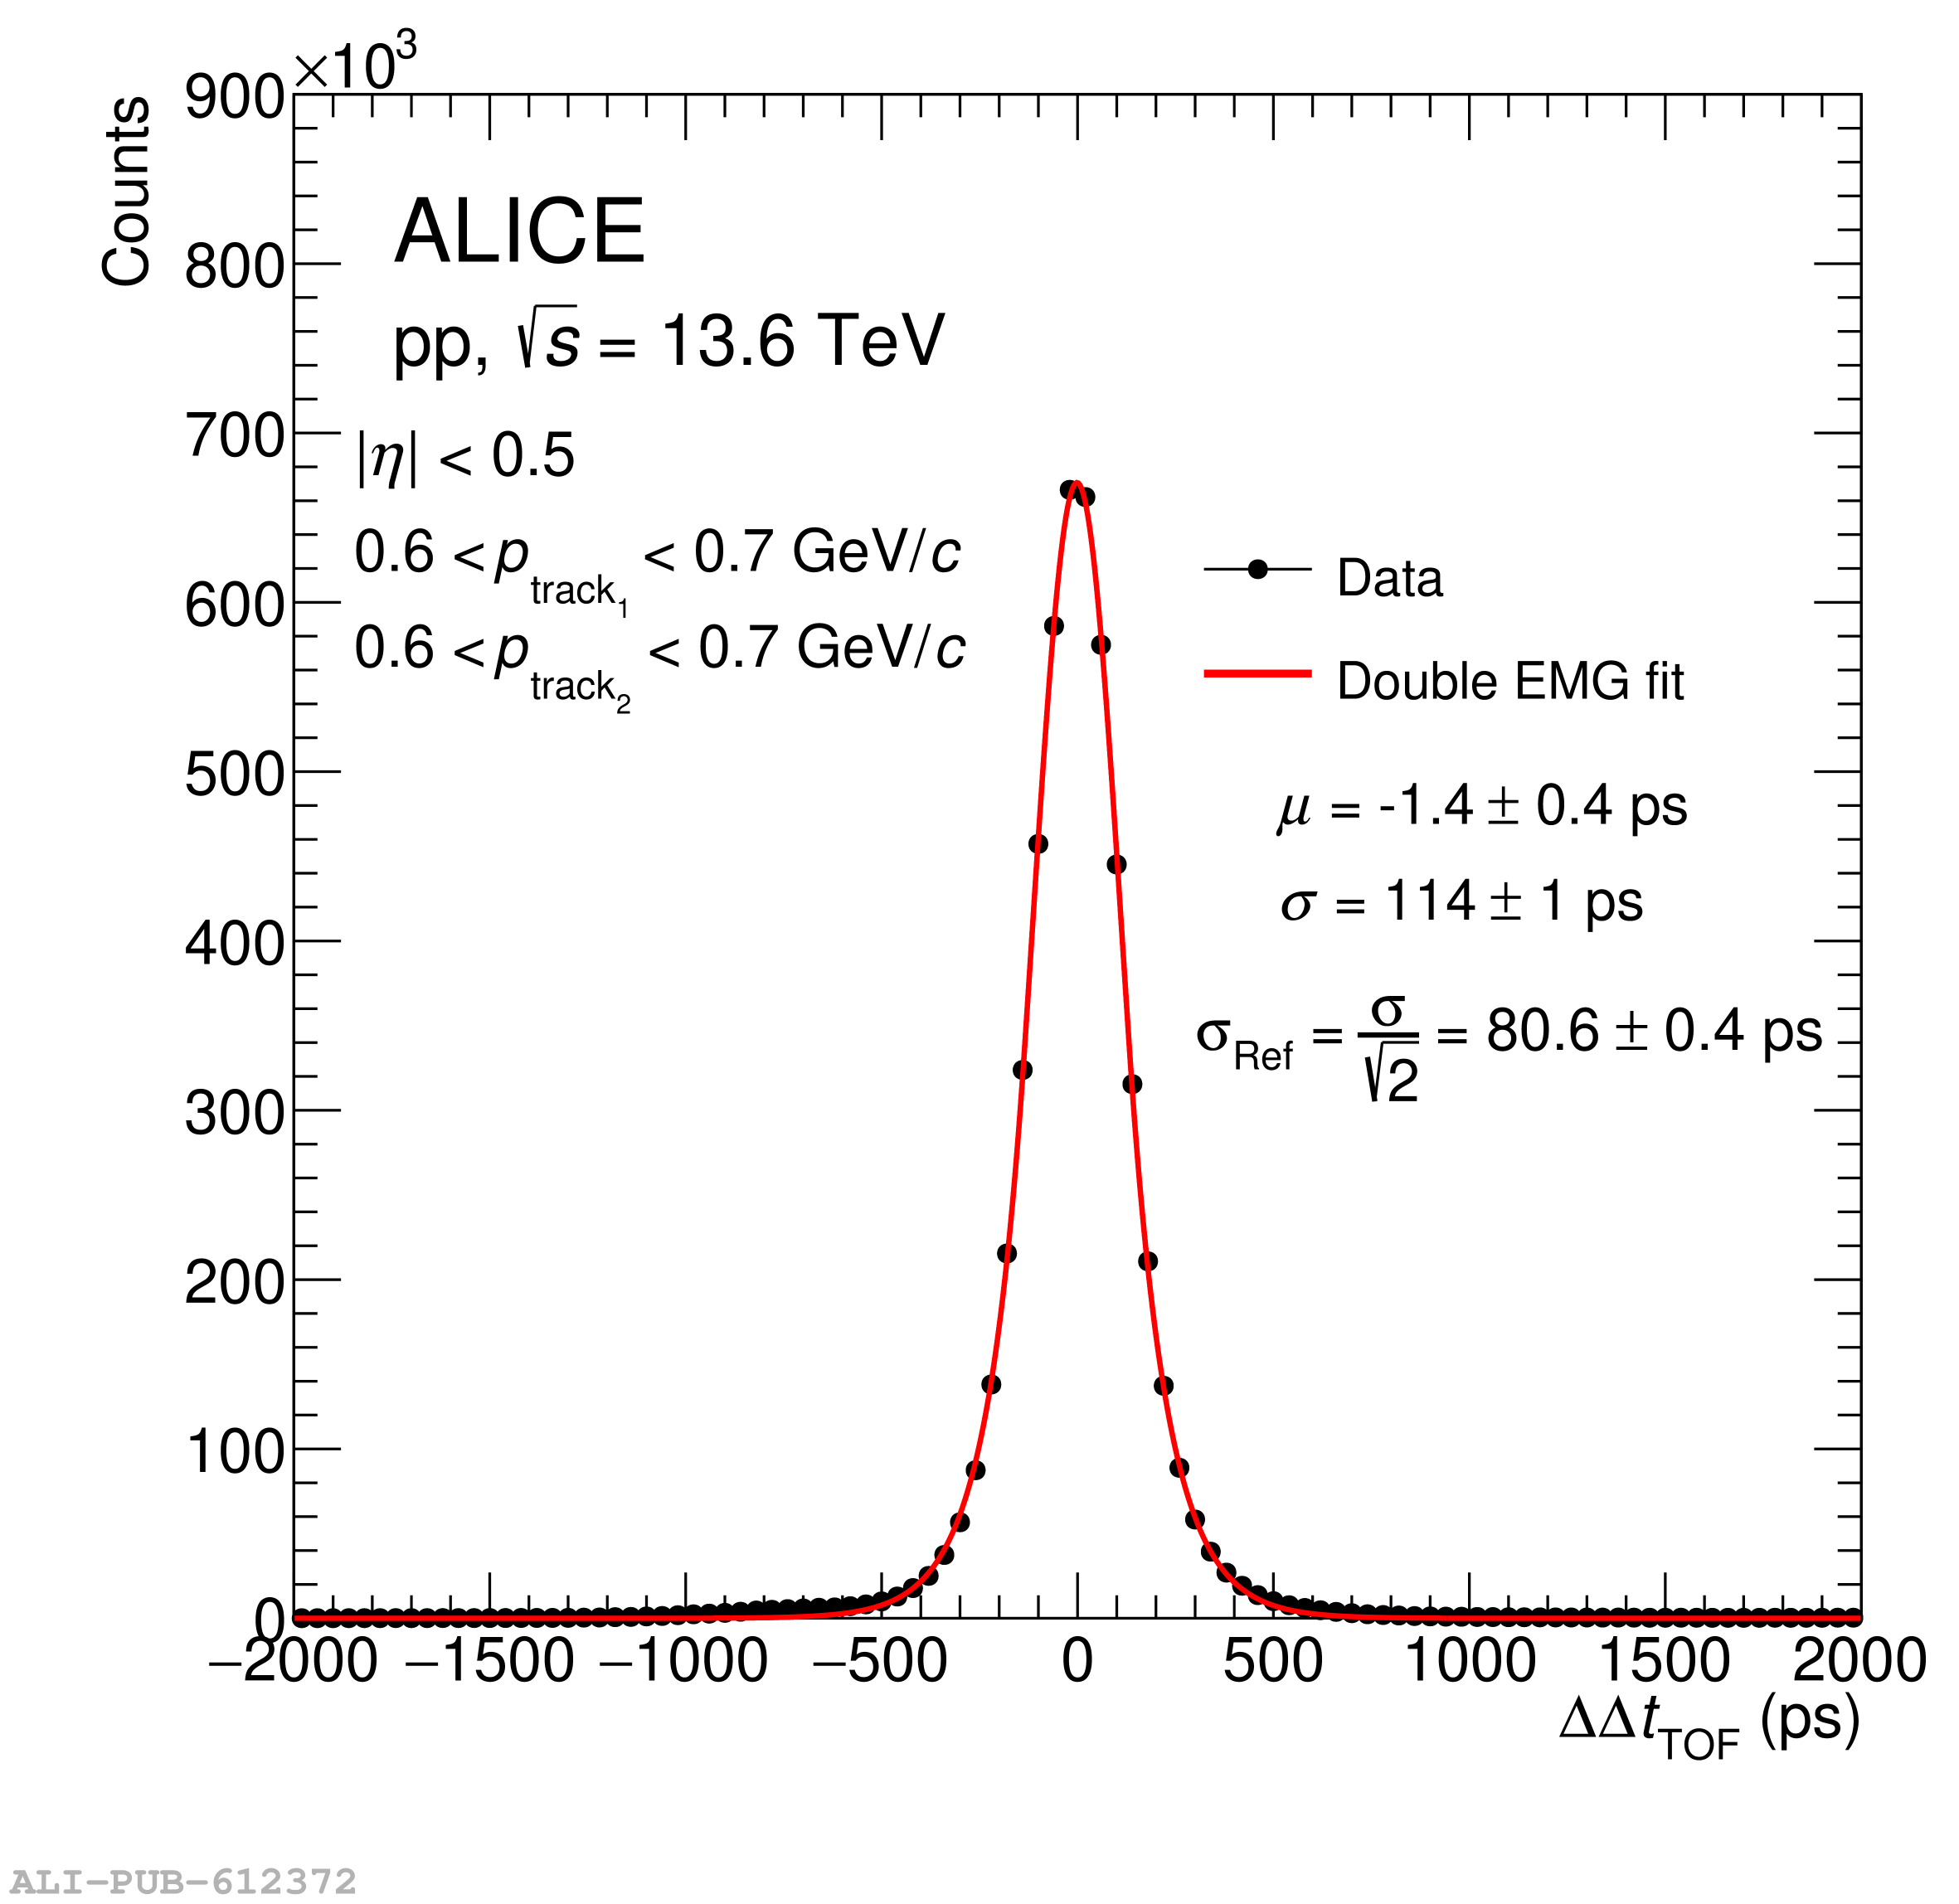
$\Delta\Delta t_{\rm TOF}$ distribution for the reference tracks, selecting both track$_1$ and track$_2$ with a momentum in the range $ 600 < p < 700$ MeV/$c$, represented by the black-shaded band in Fig.6. The fit is done over the full range of the histogram.