
(left) Signal weights at the signal peak position (circles) and at 1$\sigma$ distance from the peak (square markers) for all particles under study as a function of $p_{\rm T}$ in the INEL > 0 event class. Dashed lines are shown to guide the eye. (right) Uncorrected multiplicity distribution $n_{\mathrm{S}}^{unc}$ for all particles under study in the INEL > 0 event class, where statistical uncertainties are evaluated using the sub-samples method and are smaller than the marker size. Particles correspond to full markers, antiparticles to hollow markers. | 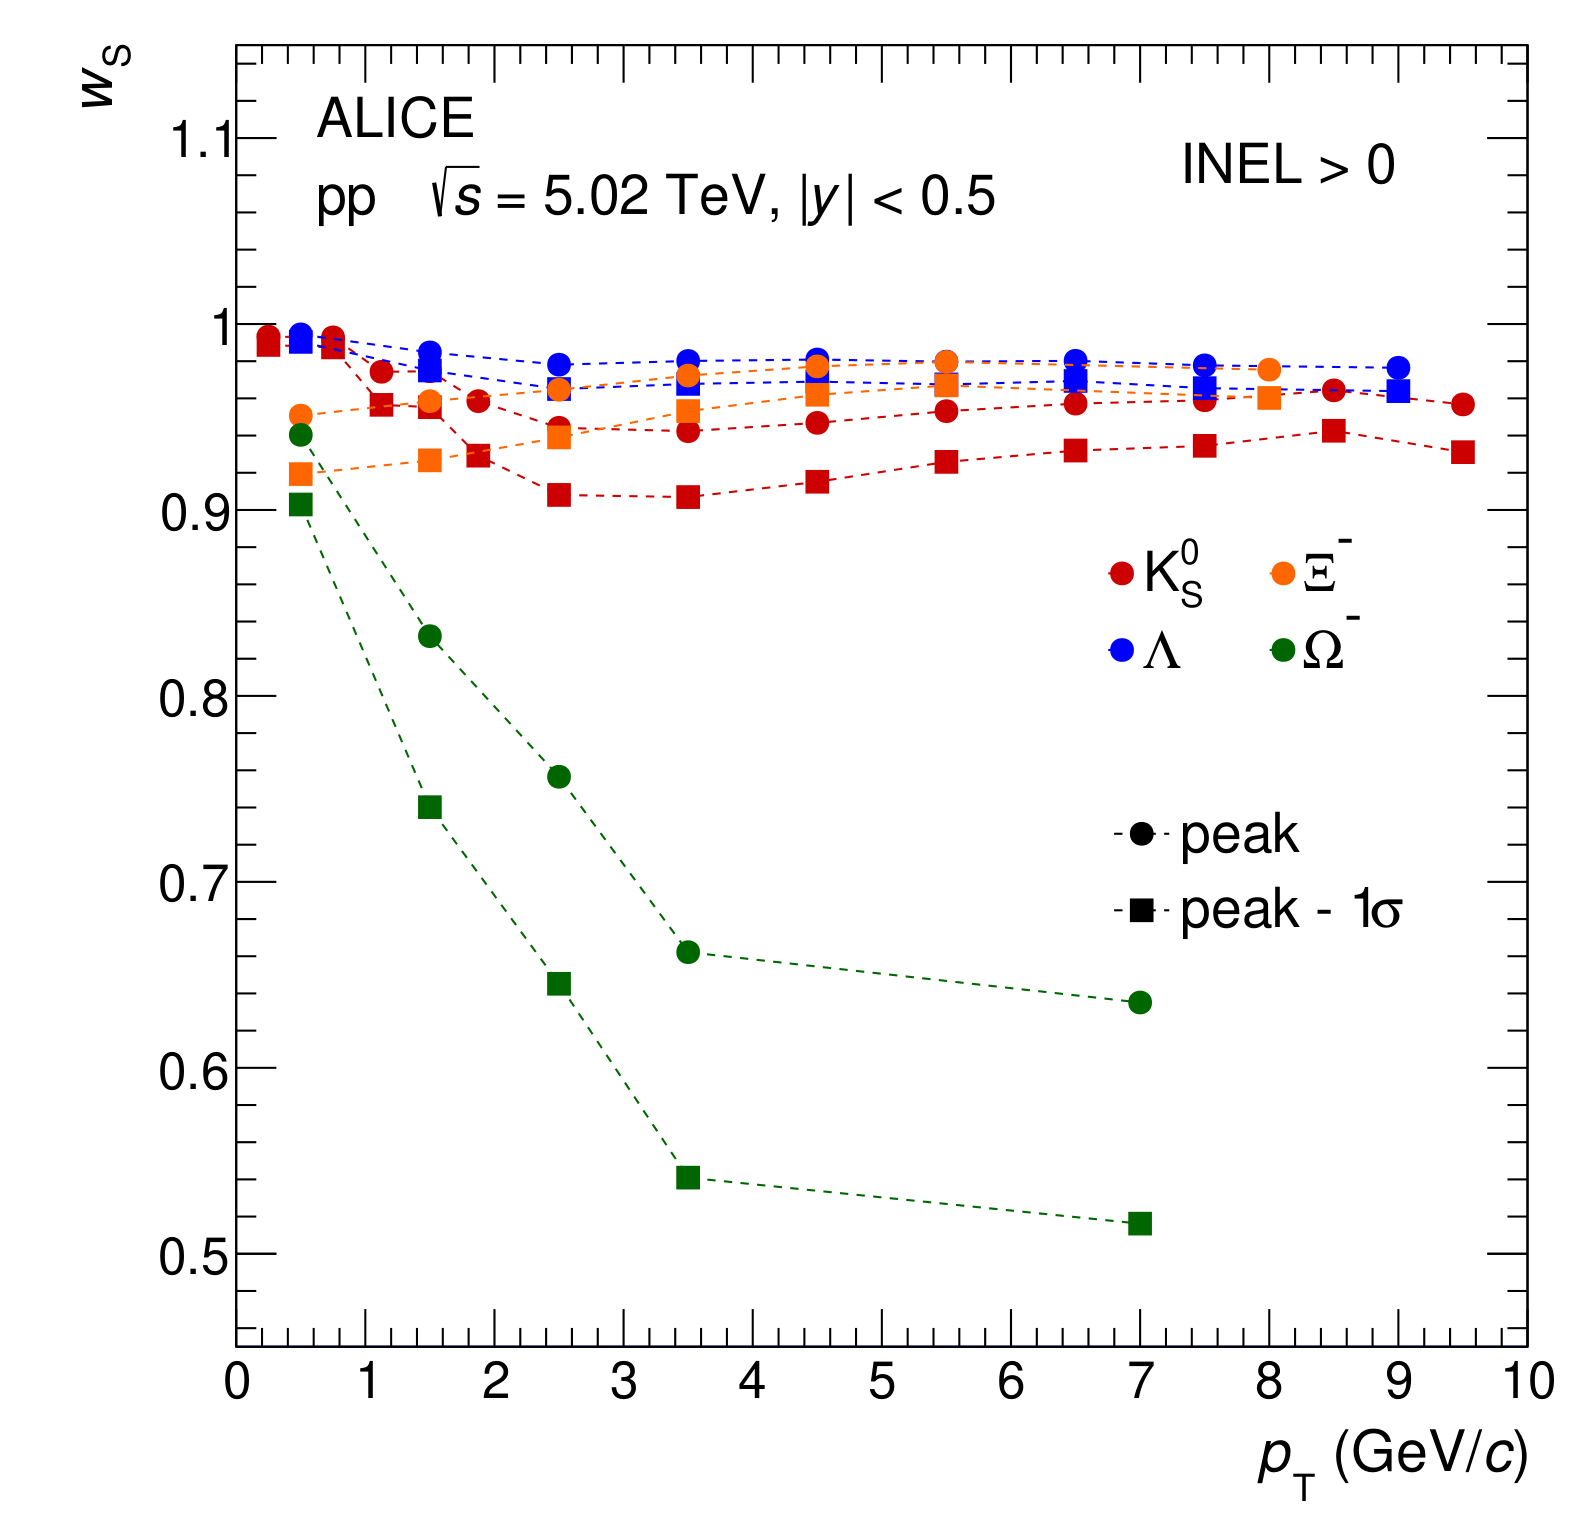 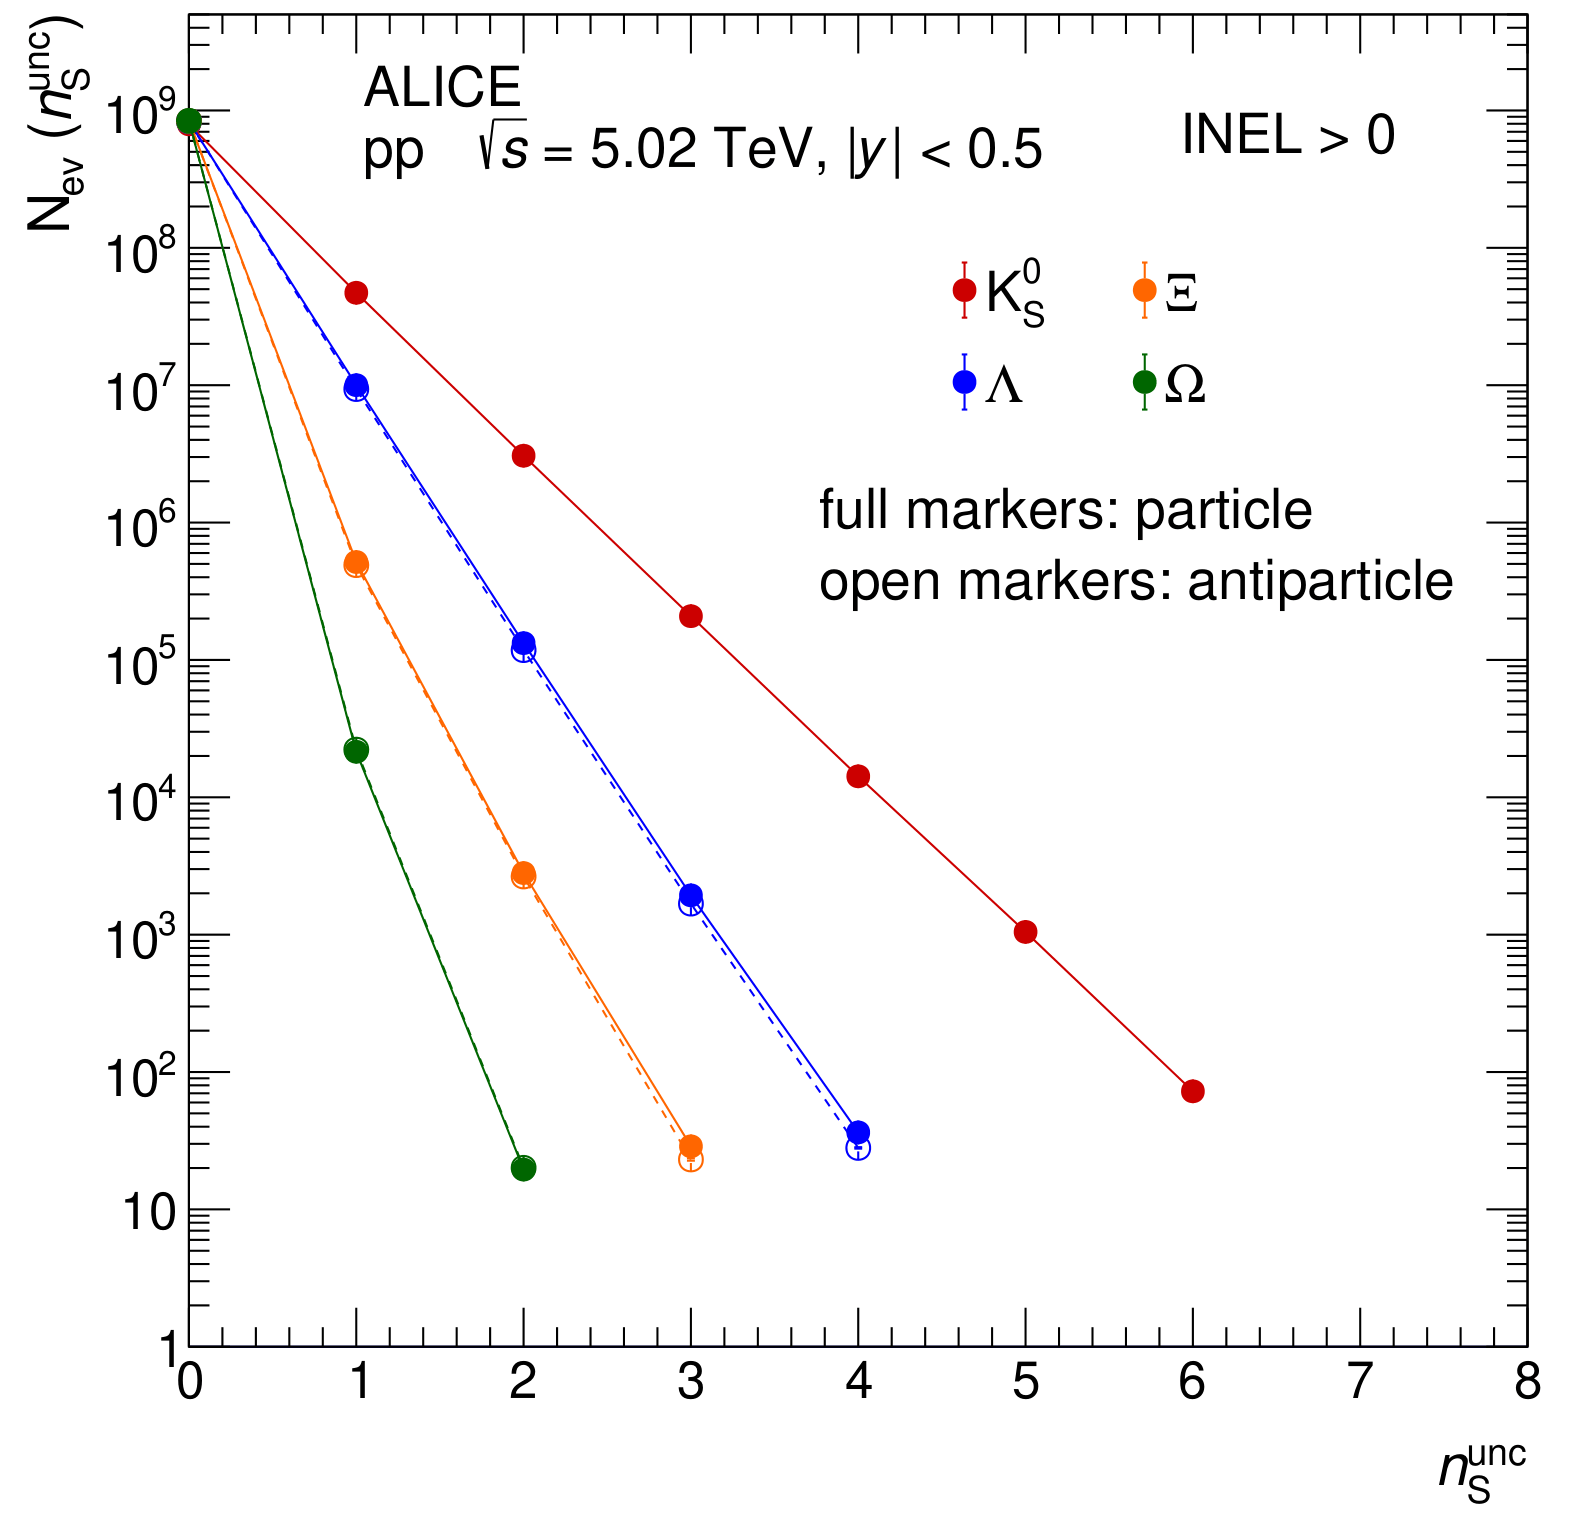 |