Double ratio \ROOpOpO compared to pQCD calculations including only CNM effects , located around unity, and to energy loss models , which exhibit a suppression similar to the one observed in data. Vertical bars (boxes) represent the statistical (systematic) uncertainty, while a box around unity denotes the normalization uncertainty due to the luminosity determination. | 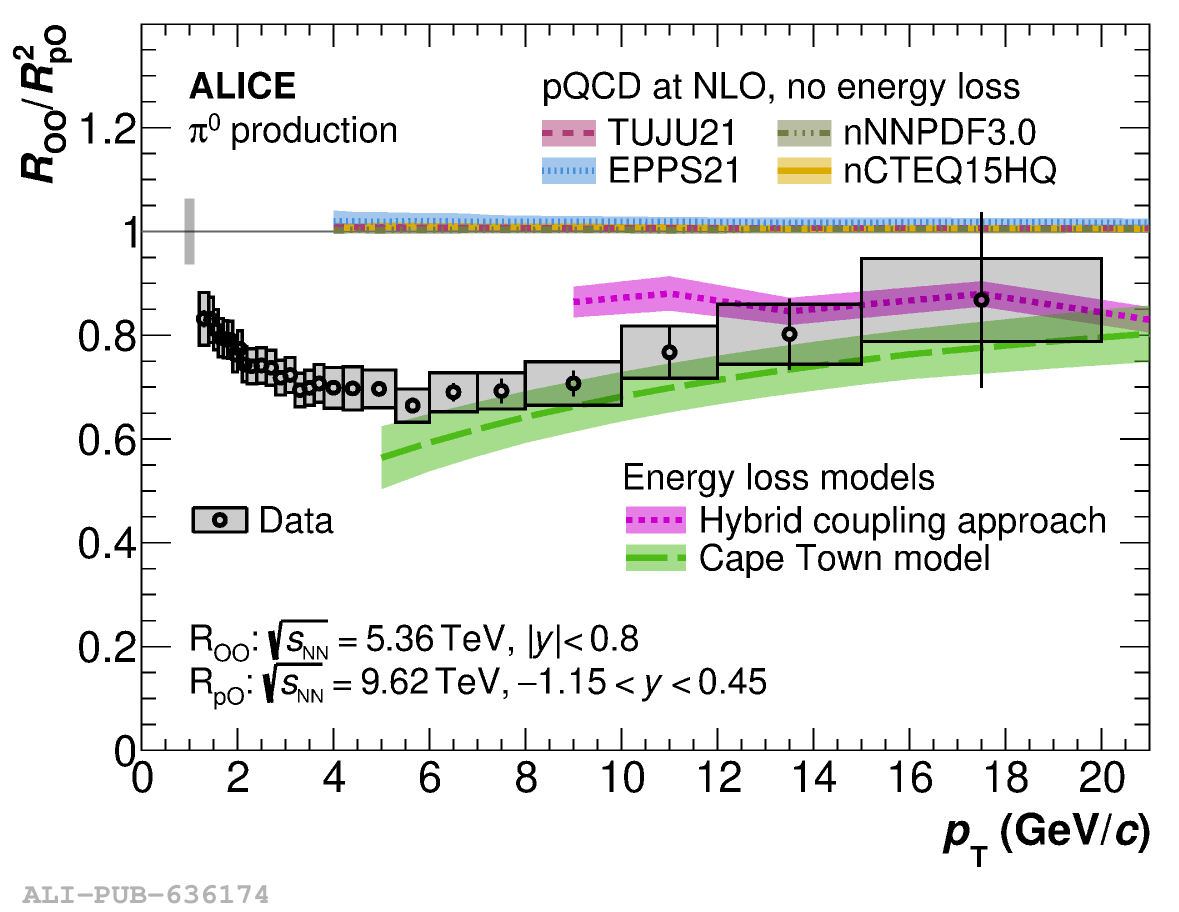 |