JEF distribution in \jetptrange{60}{80} for three jet pairs with radii of [0.05, 0.1] (top left), [0.15, 0.20] (top right), and [0.2, 0.25] (bottom) compared to PYTHIA, HERWIG, JEWEL pp and JETSCAPE (PP19 tune) in pp collisions at $\sqrt{s}=13$ TeV. The bottom panels of each figure show the ratio of MC to data, and the gray band represents the systematic uncertainty of the data. | 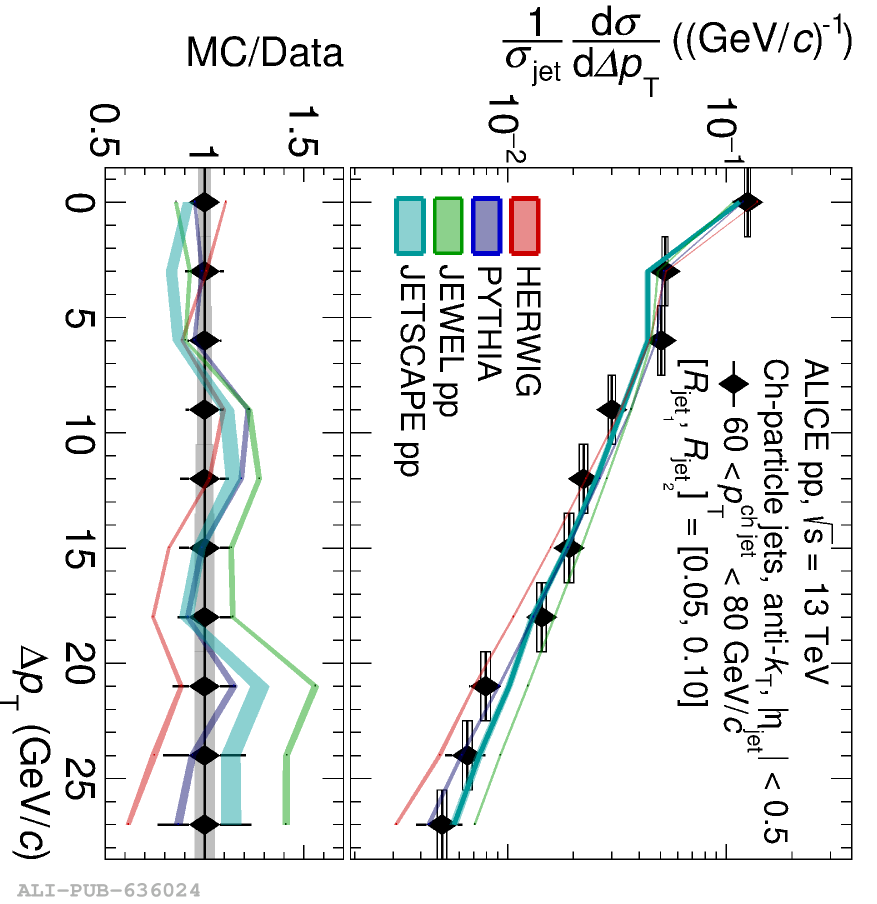 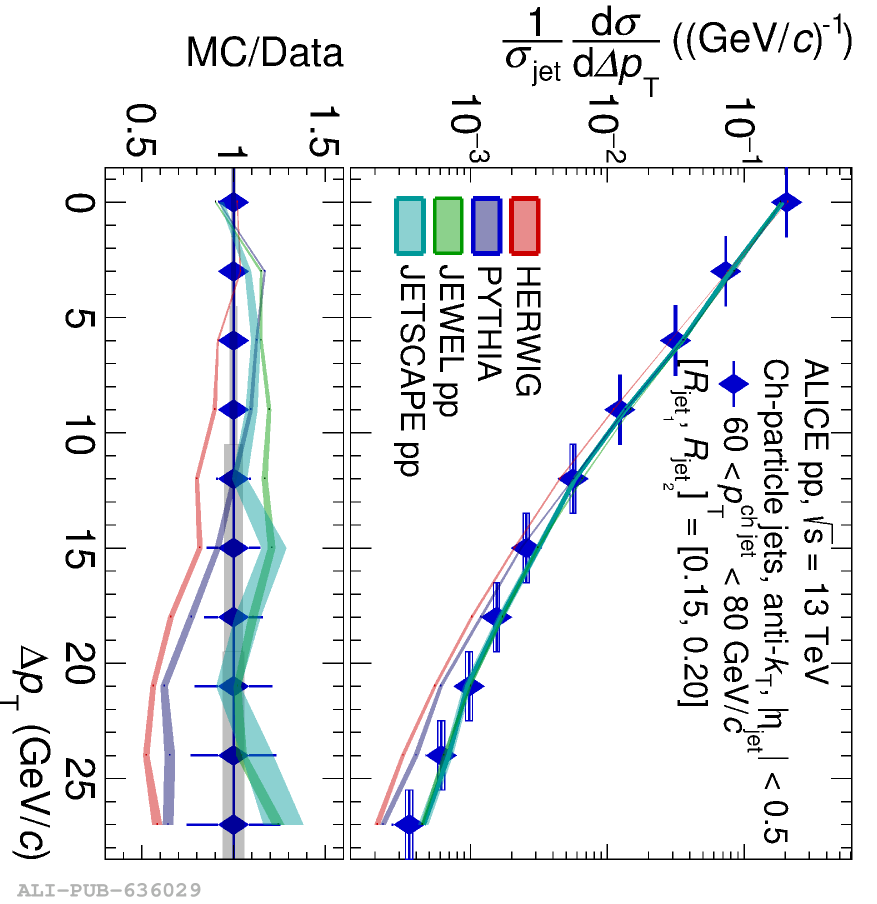 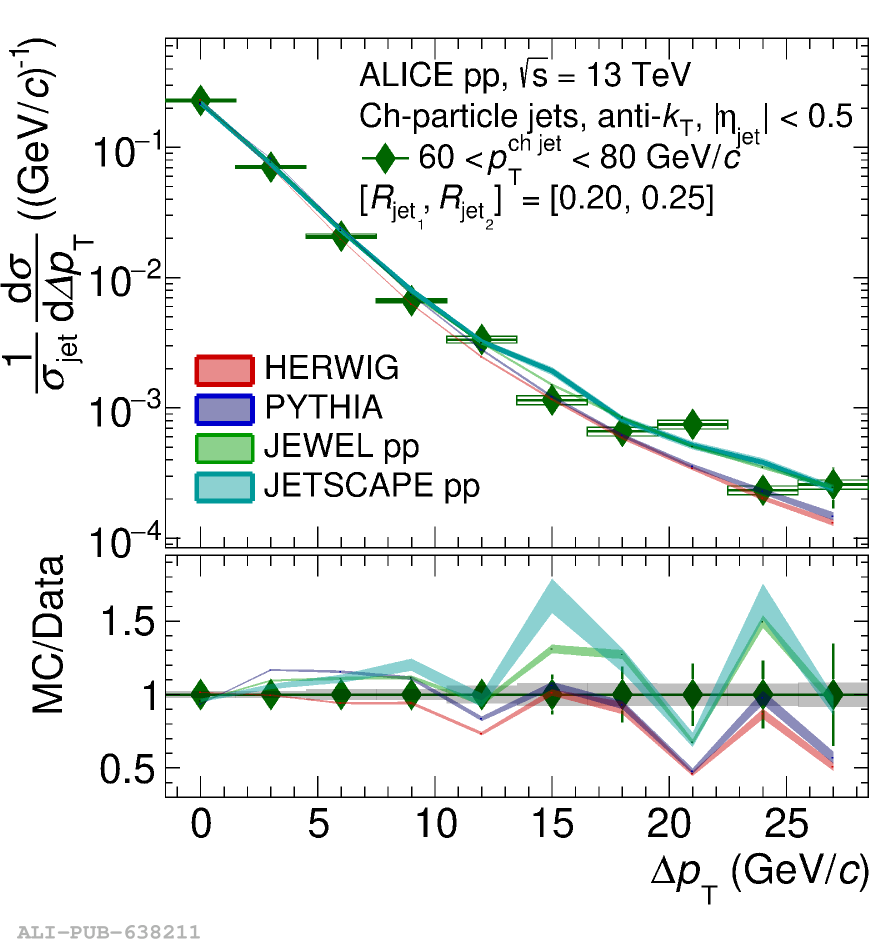 |