Azimuthal correlation distributions measured in 0$-$10% Pb$-$Pb collisions for isolated-narrow (full-light blue circles) and isolated wide (empty-violet squares) cluster triggers, and isolated-prompt photon triggers (empty-orange crosses) with 20 $< p_{\rm T}^{\rm trig}< $ 25 GeV/$\it{c}$, and for different $z_{\rm T}$ intervals (each panel). The vertical lines represent the statistical uncertainties. The dashed-green line at $|\Delta \varphi|=3/5\pi$ indicates the lower limit of the integration used in the $D(z_{\rm T})$ calculation. | 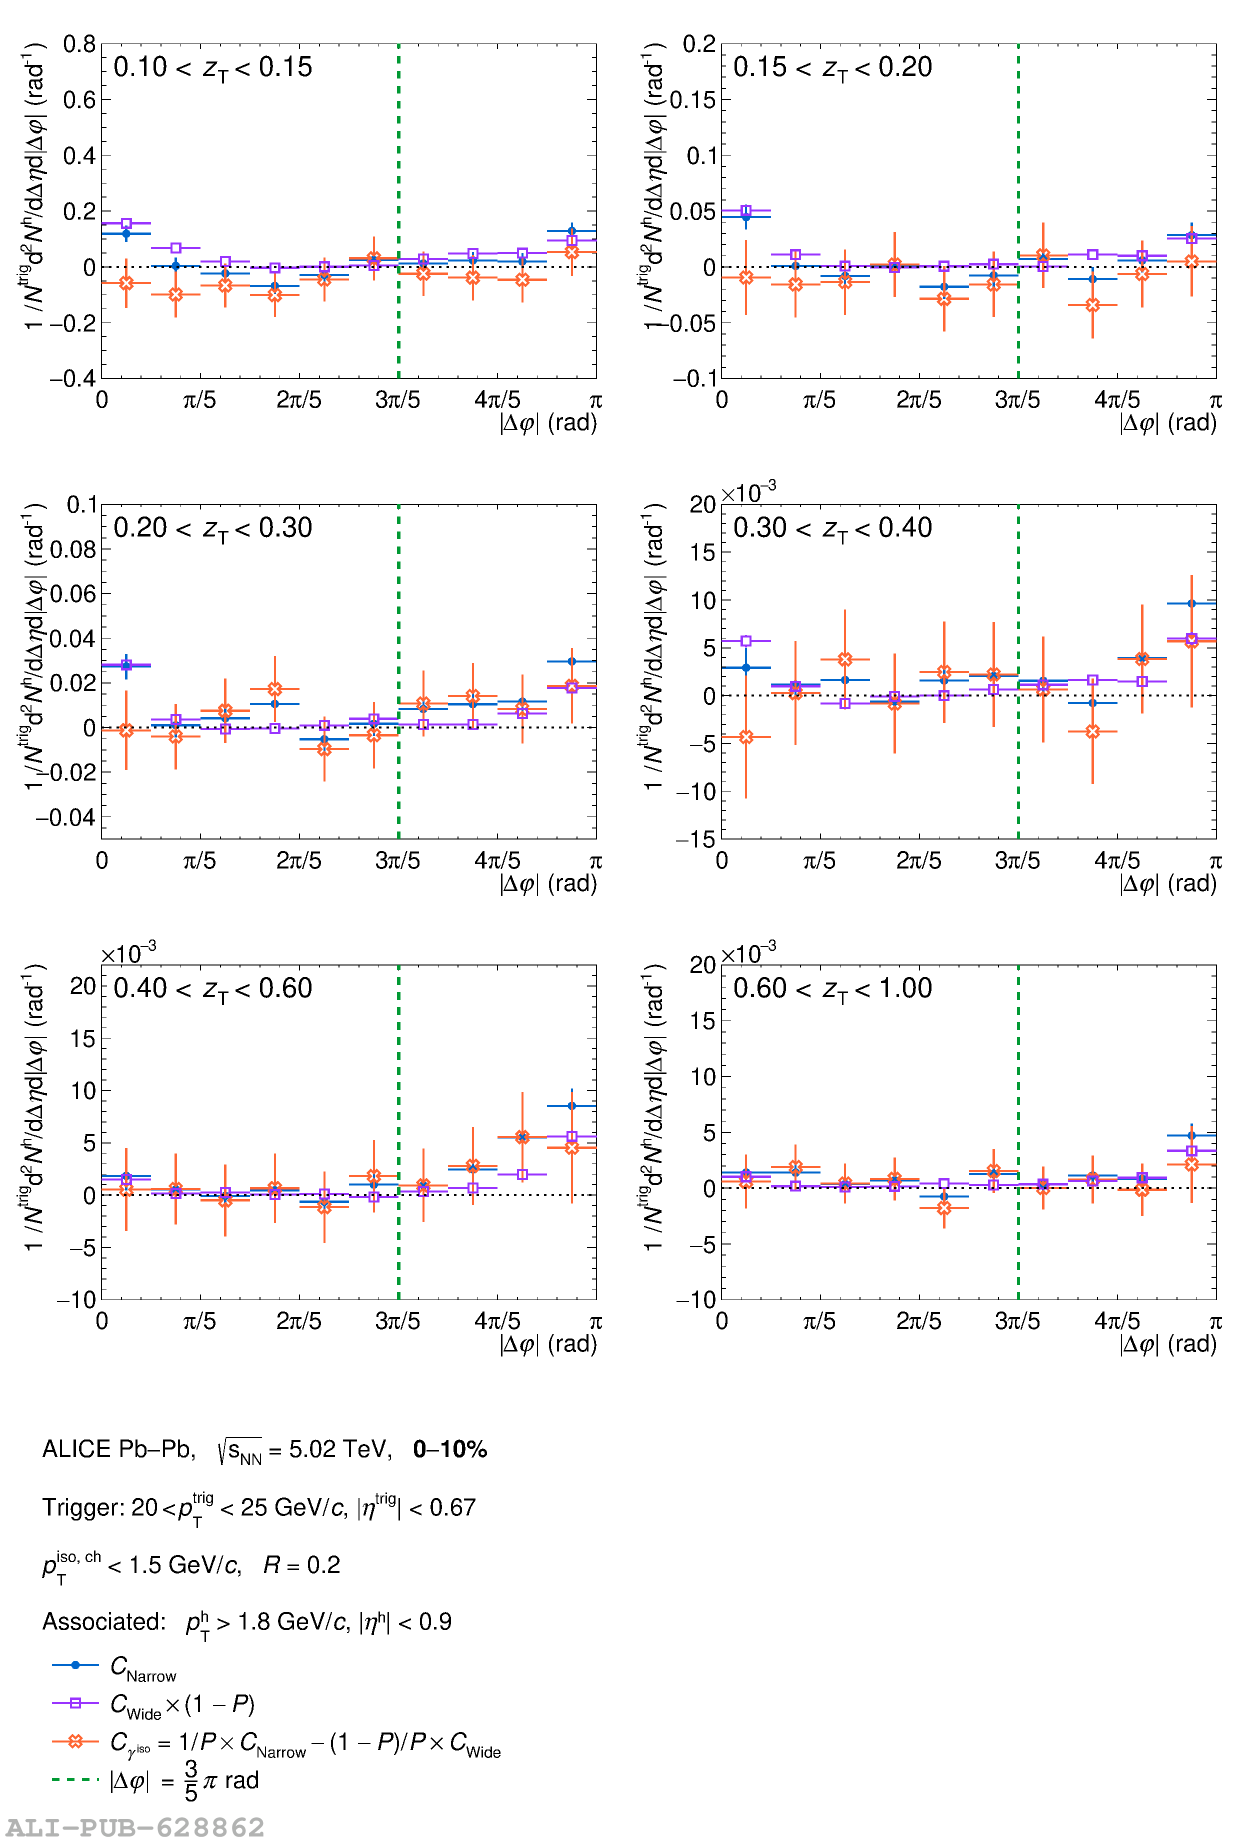 |