Azimuthal correlation distributions measured in 50$-$90% Pb$-$Pb collisions for isolated-narrow-cluster triggers with 20 $< p_{\rm T}^{\rm trig}< $ 25 GeV/$\it{c}$, and for different $z_{\rm T}$ intervals (each panel): for the same event (empty-black circles), for the mixed event (full-red squares), and the result of the subtraction (full-light blue circles). The vertical lines represent the statistical uncertainties. | 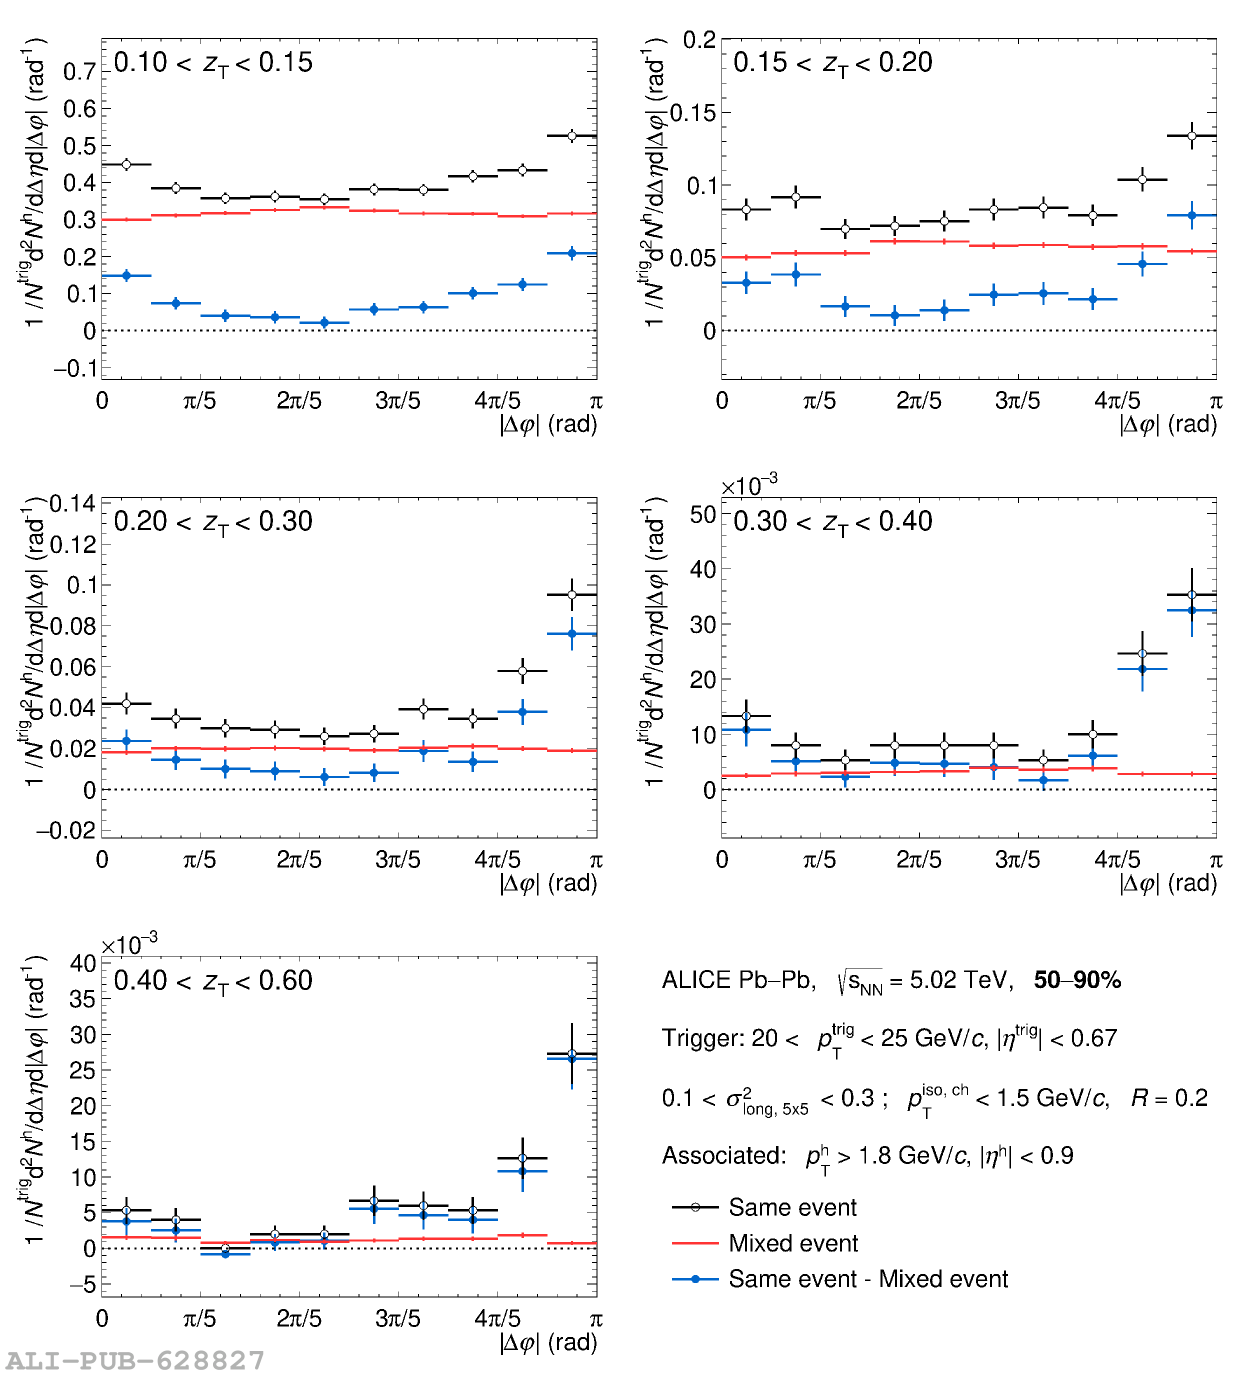 |