The $I_{\rm pQCD}$ distribution for 0$-$30% Pb$-$Pb collisions (full-red square), and the measured $I_{\rm pA}$ from Ref. [2] (open-black squares) as a function of $z_{\rm T}$. The boxes and vertical lines represent the systematic and statistical uncertainties, respectively. For Pb$-$Pb collisions $\it{I}_{\rm{pQCD}}$, the green-open boxes represent the $\mu$ scale uncertainty for the denominator NLO pQCD calculation for pp collisions. The results are compared with a theory estimation for $\it{I}_{\rm{AA}}$ with CNM effects only (light orange-dashed line and uncertainty band). Note the selection criteria for the Pb$-$Pb measurements and theory, and pp and p$-$Pb collisions are different, as shown in the legend. The effects of the different selection criteria are expected to cancel in the ratio. | 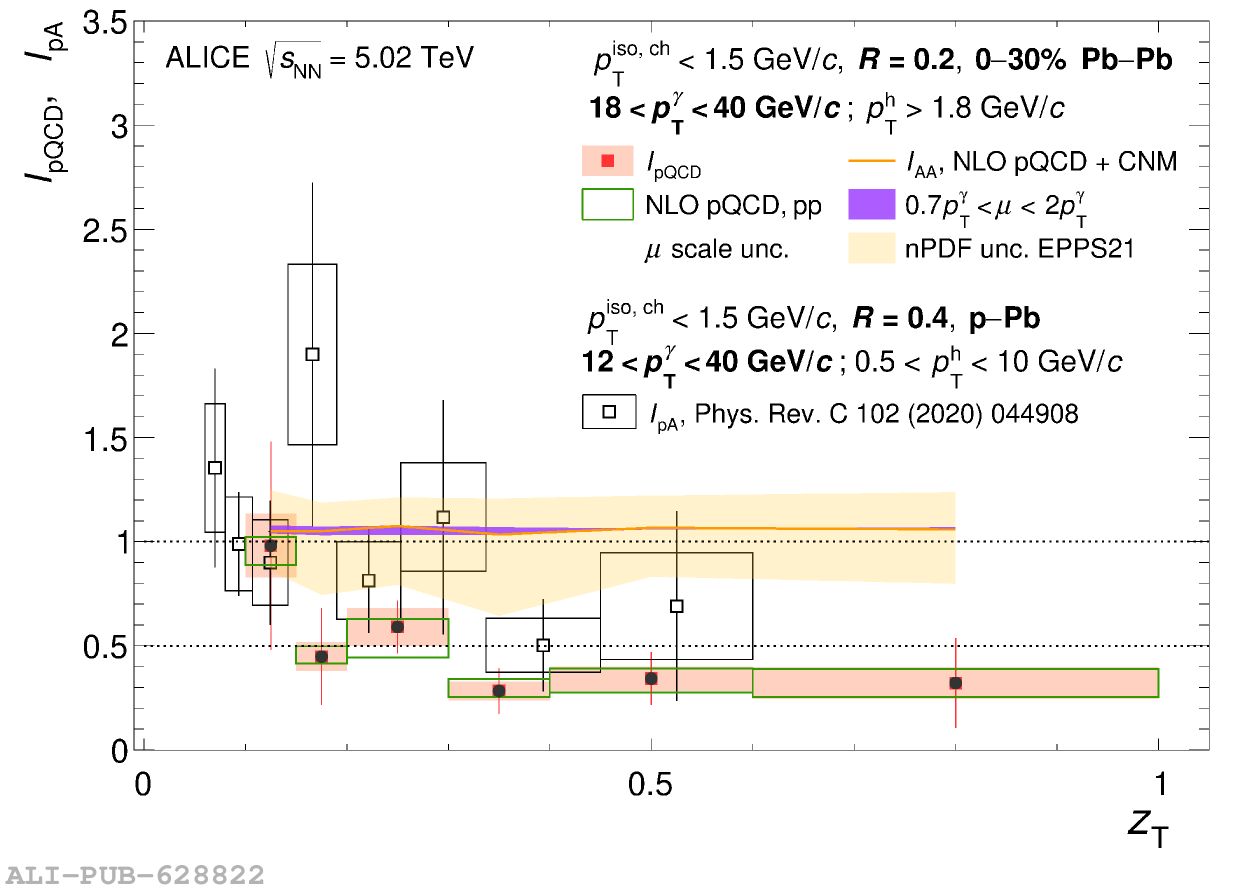 |