The $D(z_{\rm T})$ distributions in 0$-$30% (full-red squares) Pb$-$Pb collisions, in pp (full-black circles), and in p$-$Pb (empty-black circles) collisions from Ref. [2] as a function of $z_{\rm T}$. The boxes and vertical lines represent the systematic and statistical uncertainties, respectively. The results are compared with an NLO pQCD D($z_{\rm T}$) theory estimation (light brown-dashed band). Note the selection criteria for the Pb$-$Pb measurements and theory, and pp and p$-$Pb collisions are different, as shown in the legend and discussed in the text. | 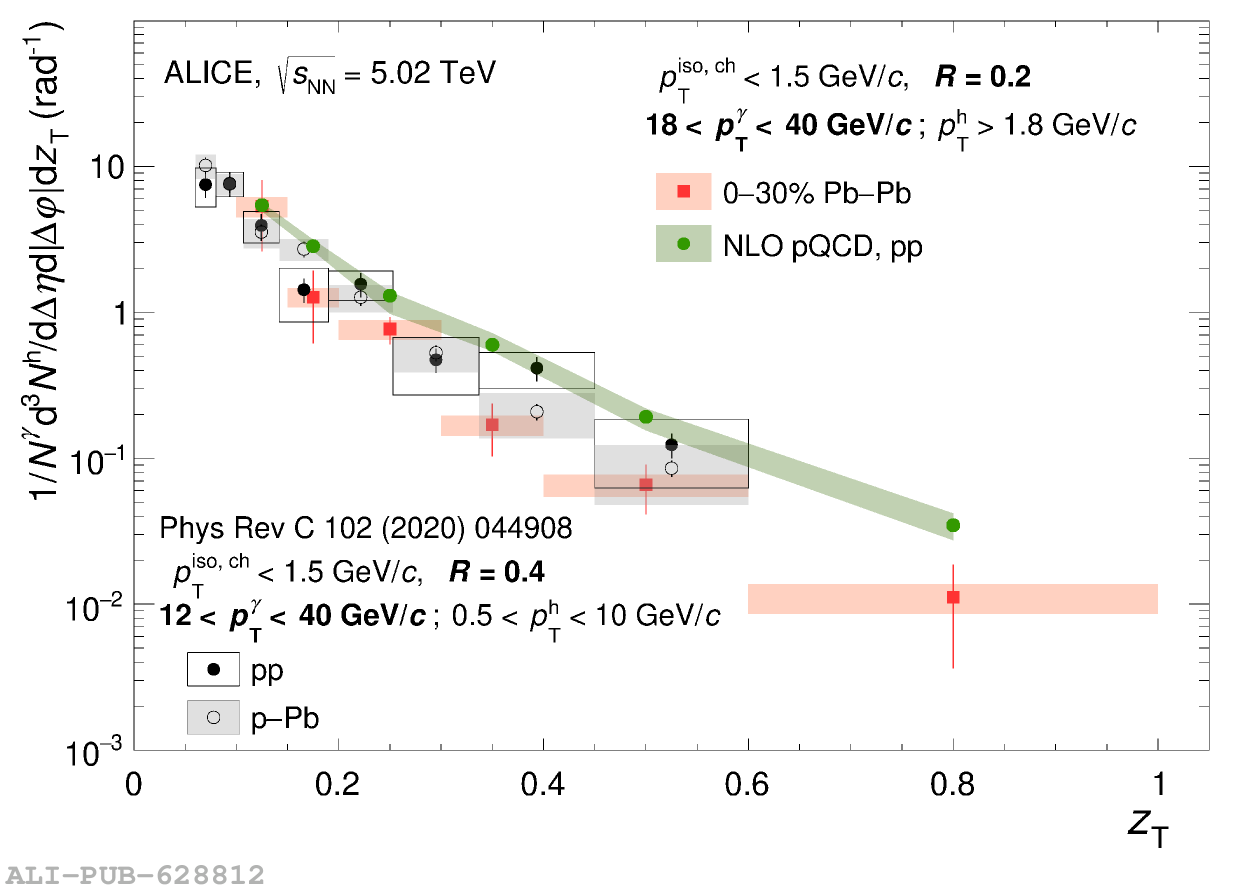 |