
Invariant-mass distributions of \ee pairs in the same event for the lowest (left) and the highest (right) \ptee intervals. Superimposed to the data are the fits containing the signals of \jpsi and \psis and the correlated (blue area) and uncorrelated (gray area) background sources (see text). | 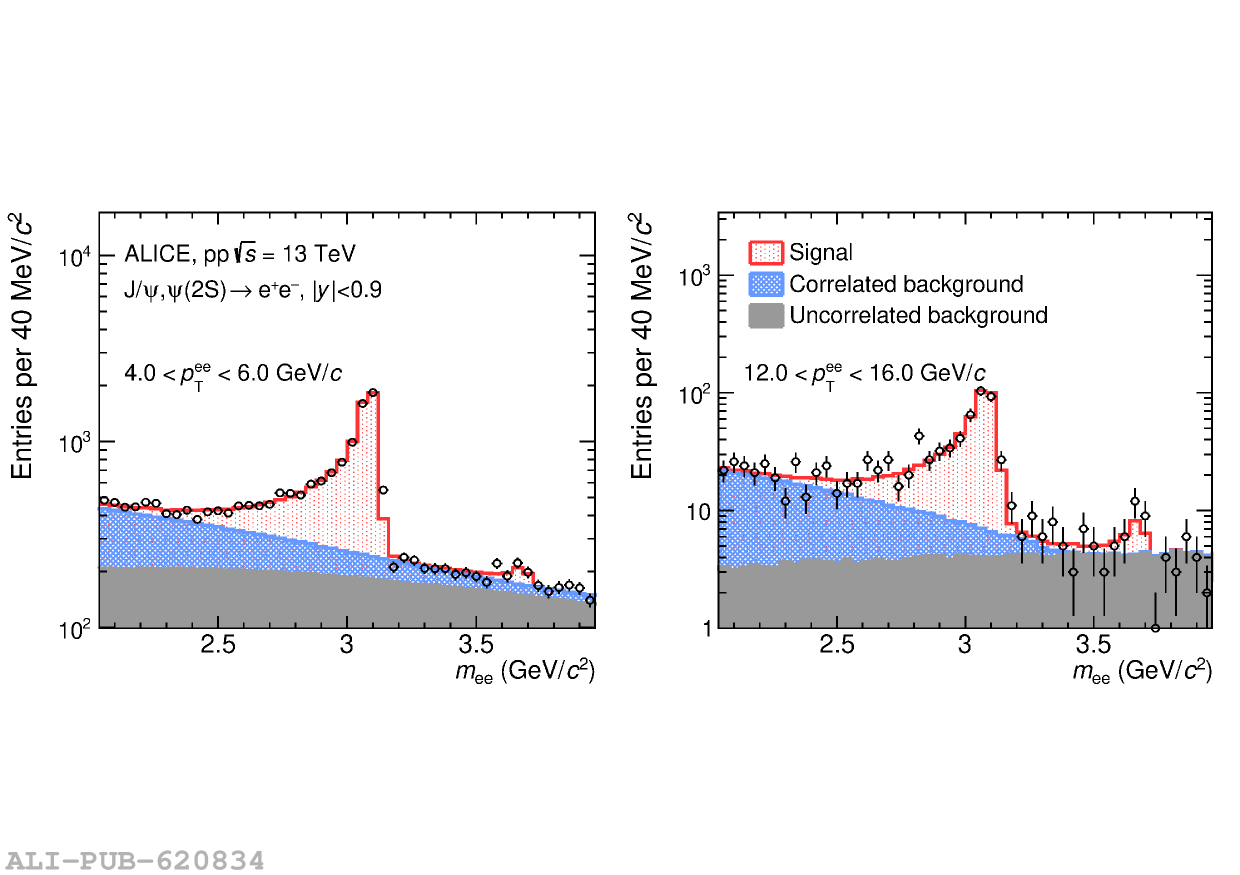 |