Comparison of peak position (left column) and full width at half maximum, FWHM, (right column) in pp (top row) and p--Pb collisions (bottom row) in data and MC simulations. The PYTHIA 8 and DPMJET 3.0-5 event generators were used for Monte-Carlo simulations. The PDG mass values of $\overline{\Sigma}^{+}$ and $\overline{\Sigma}^{-}$ are shown with short and long dashed lines, respectively. | 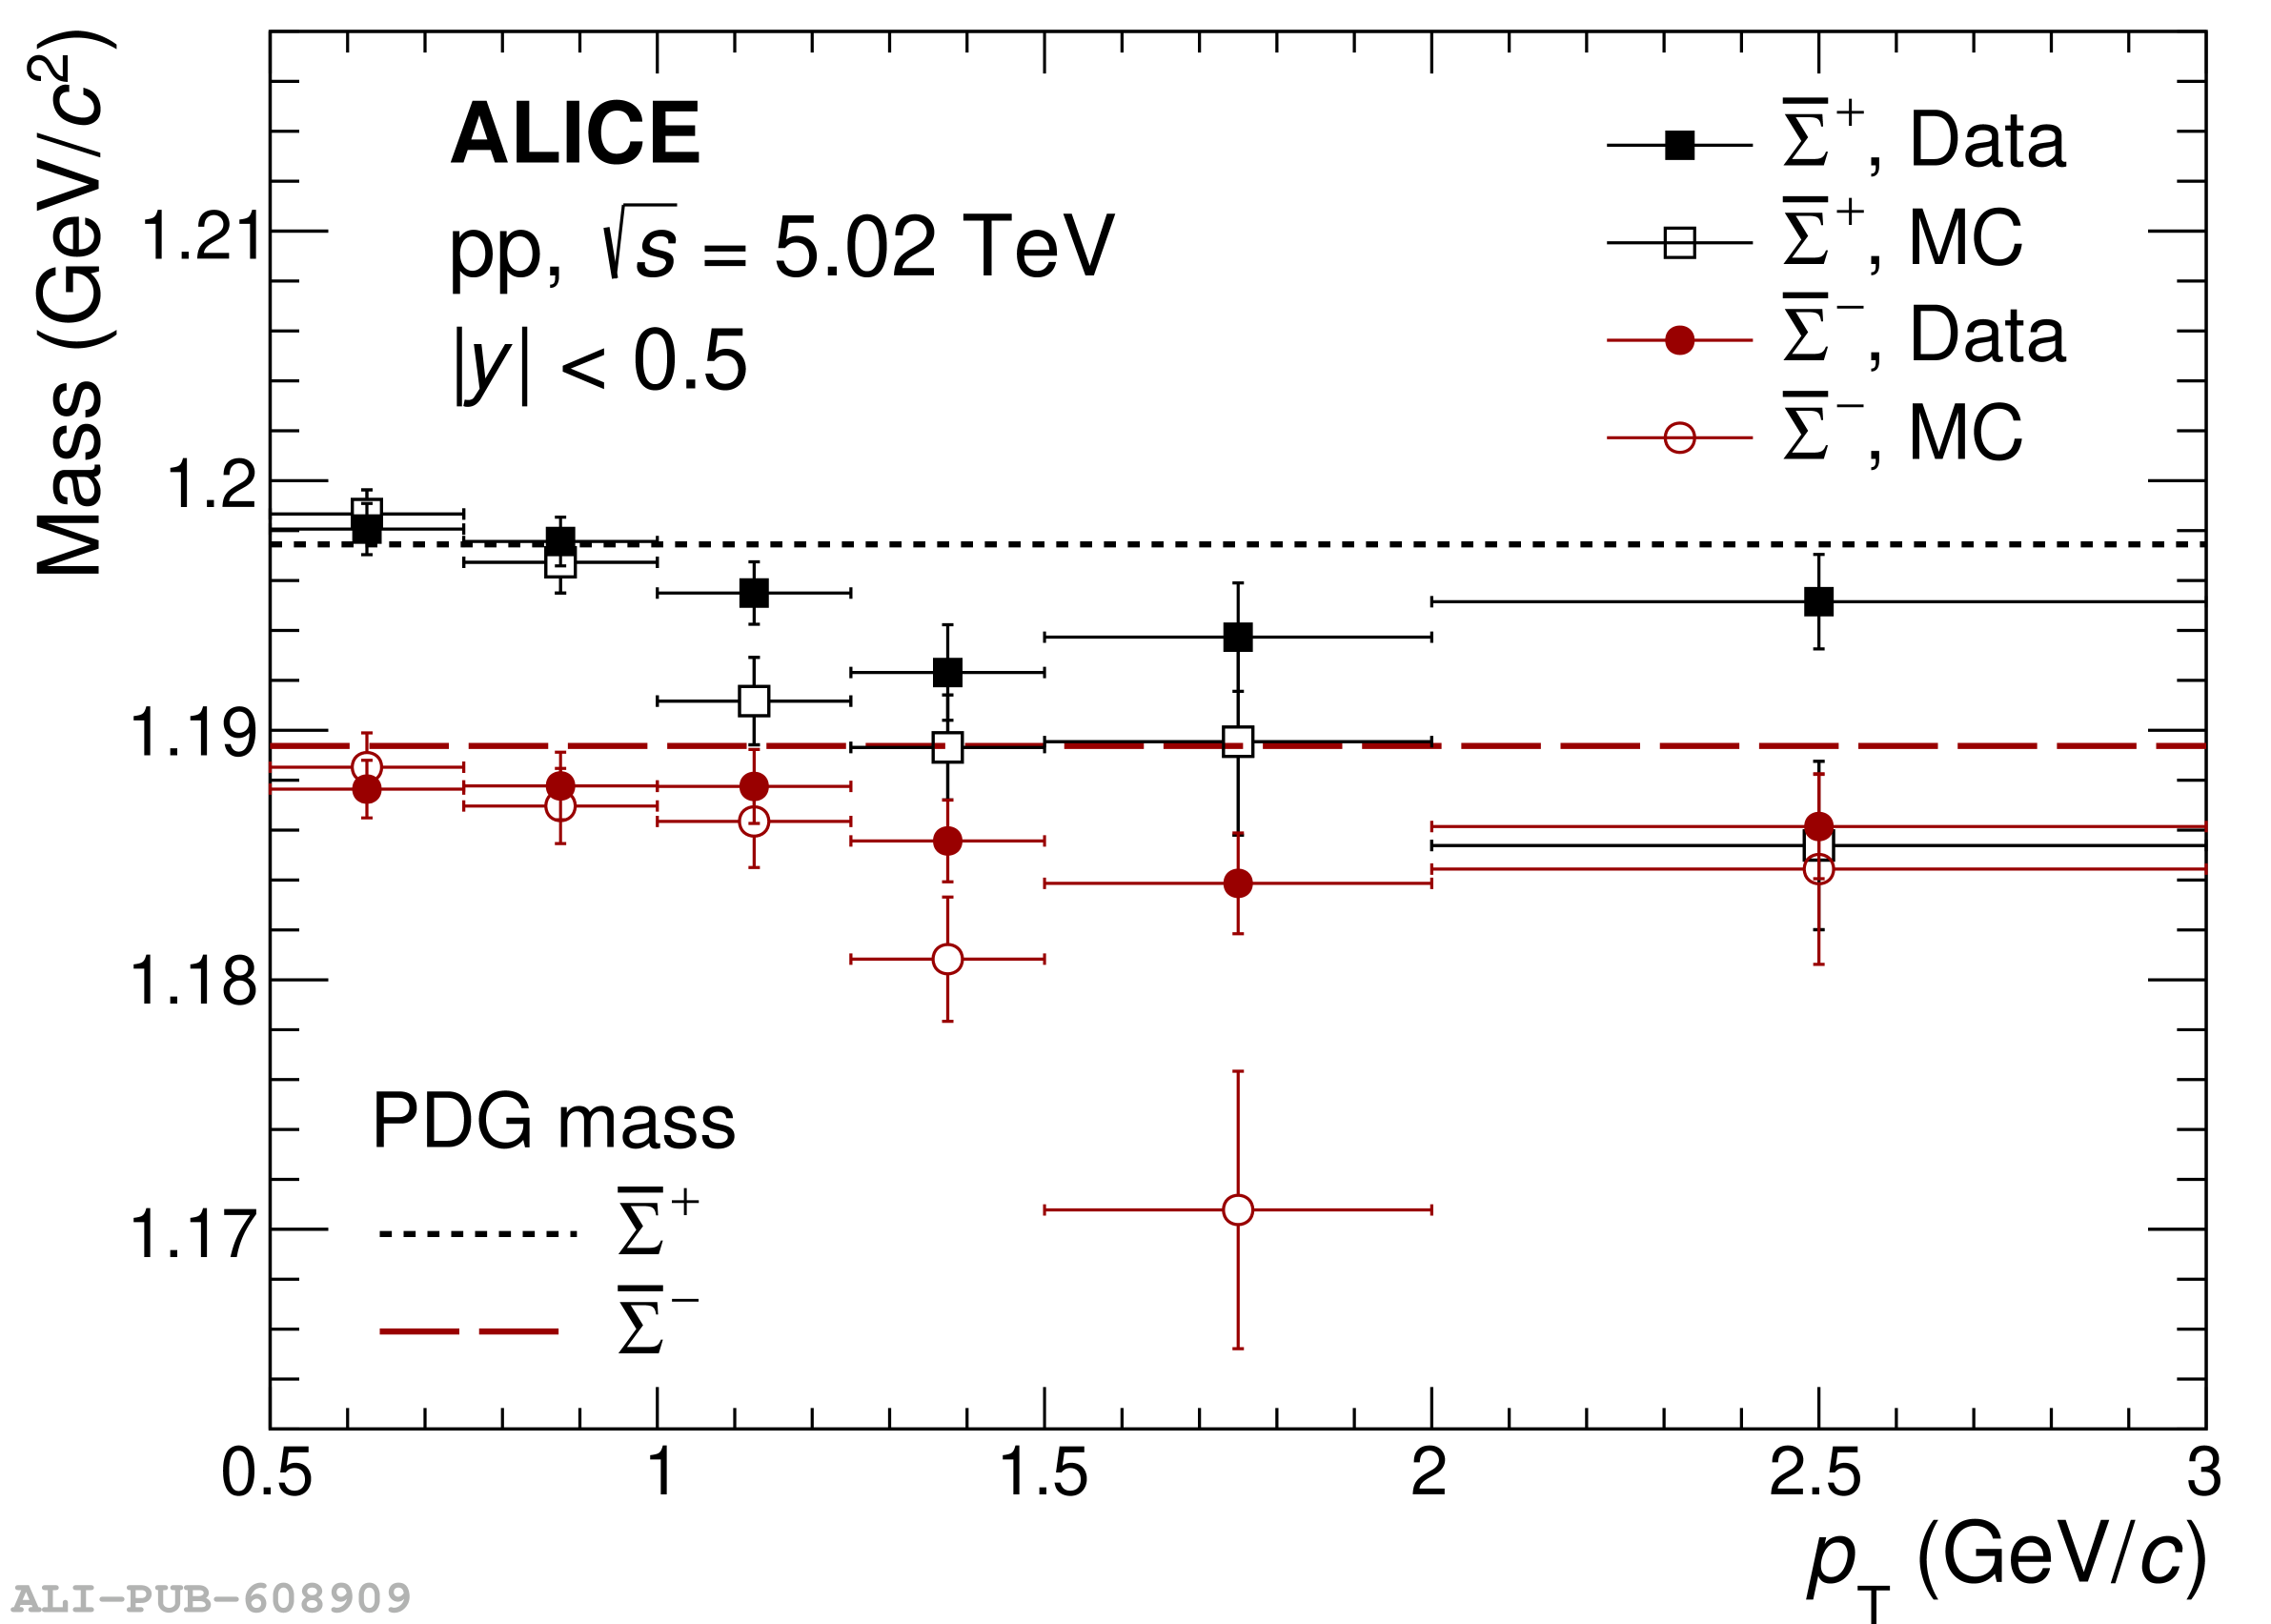 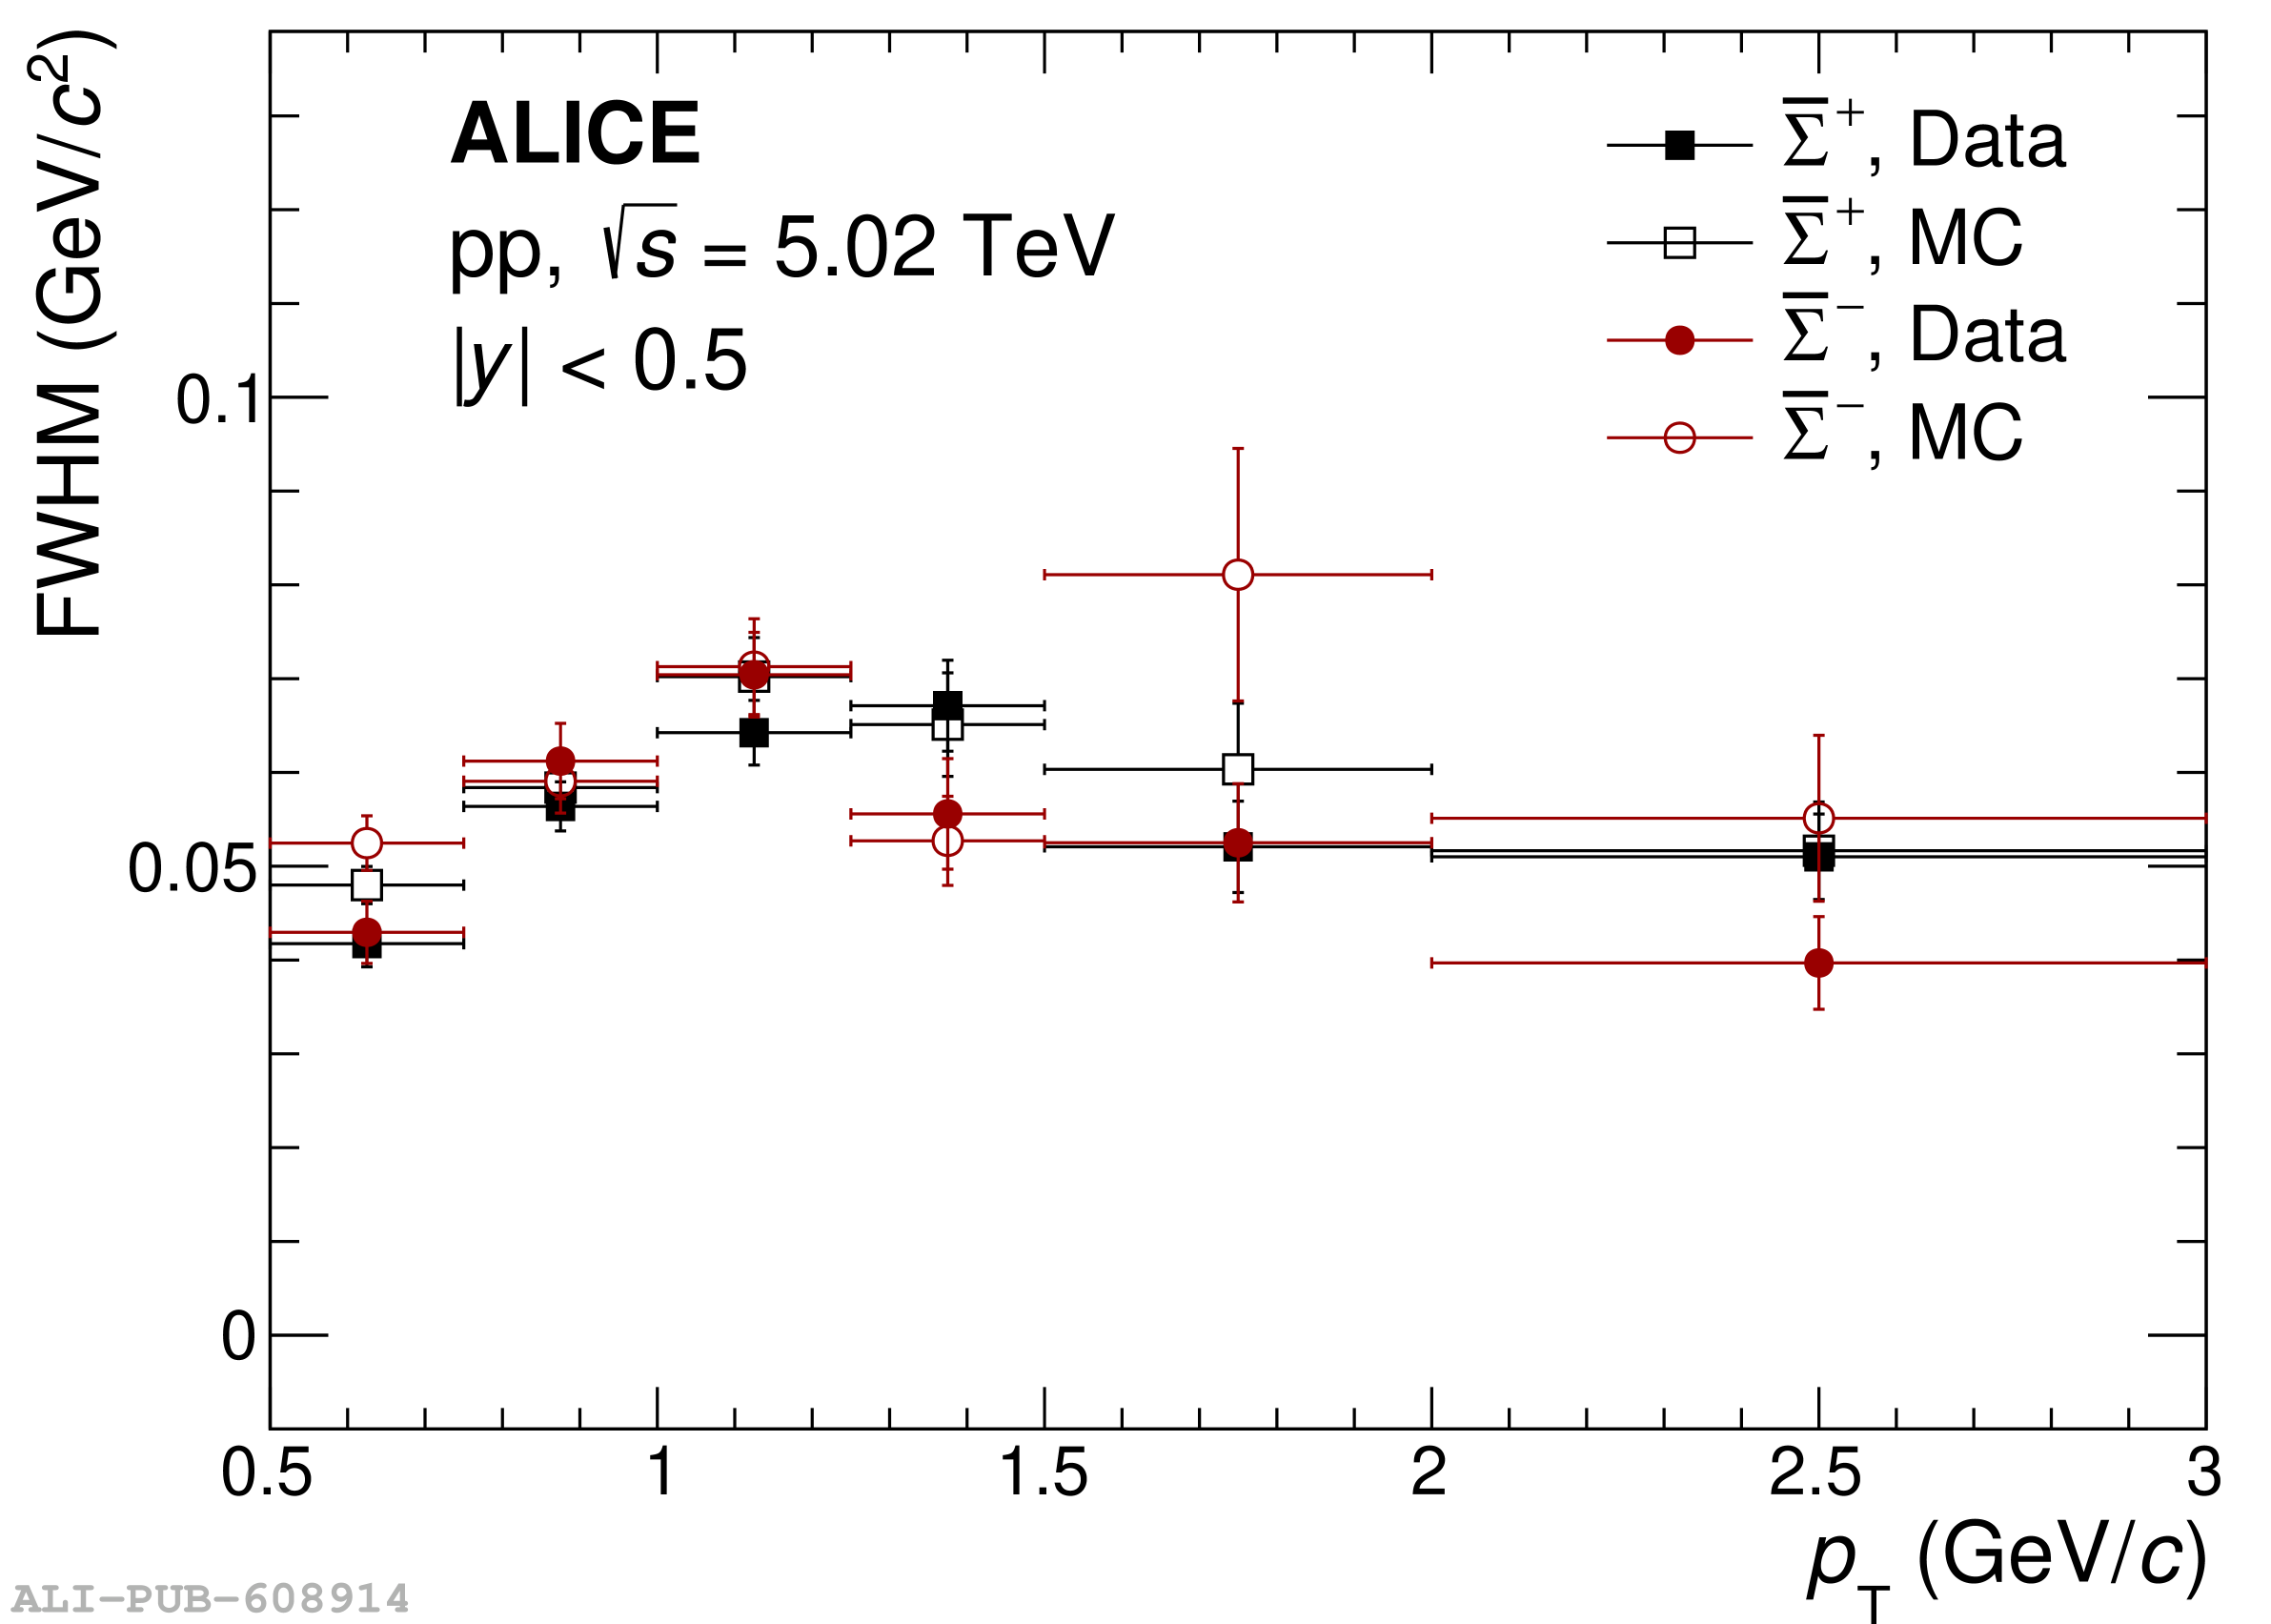 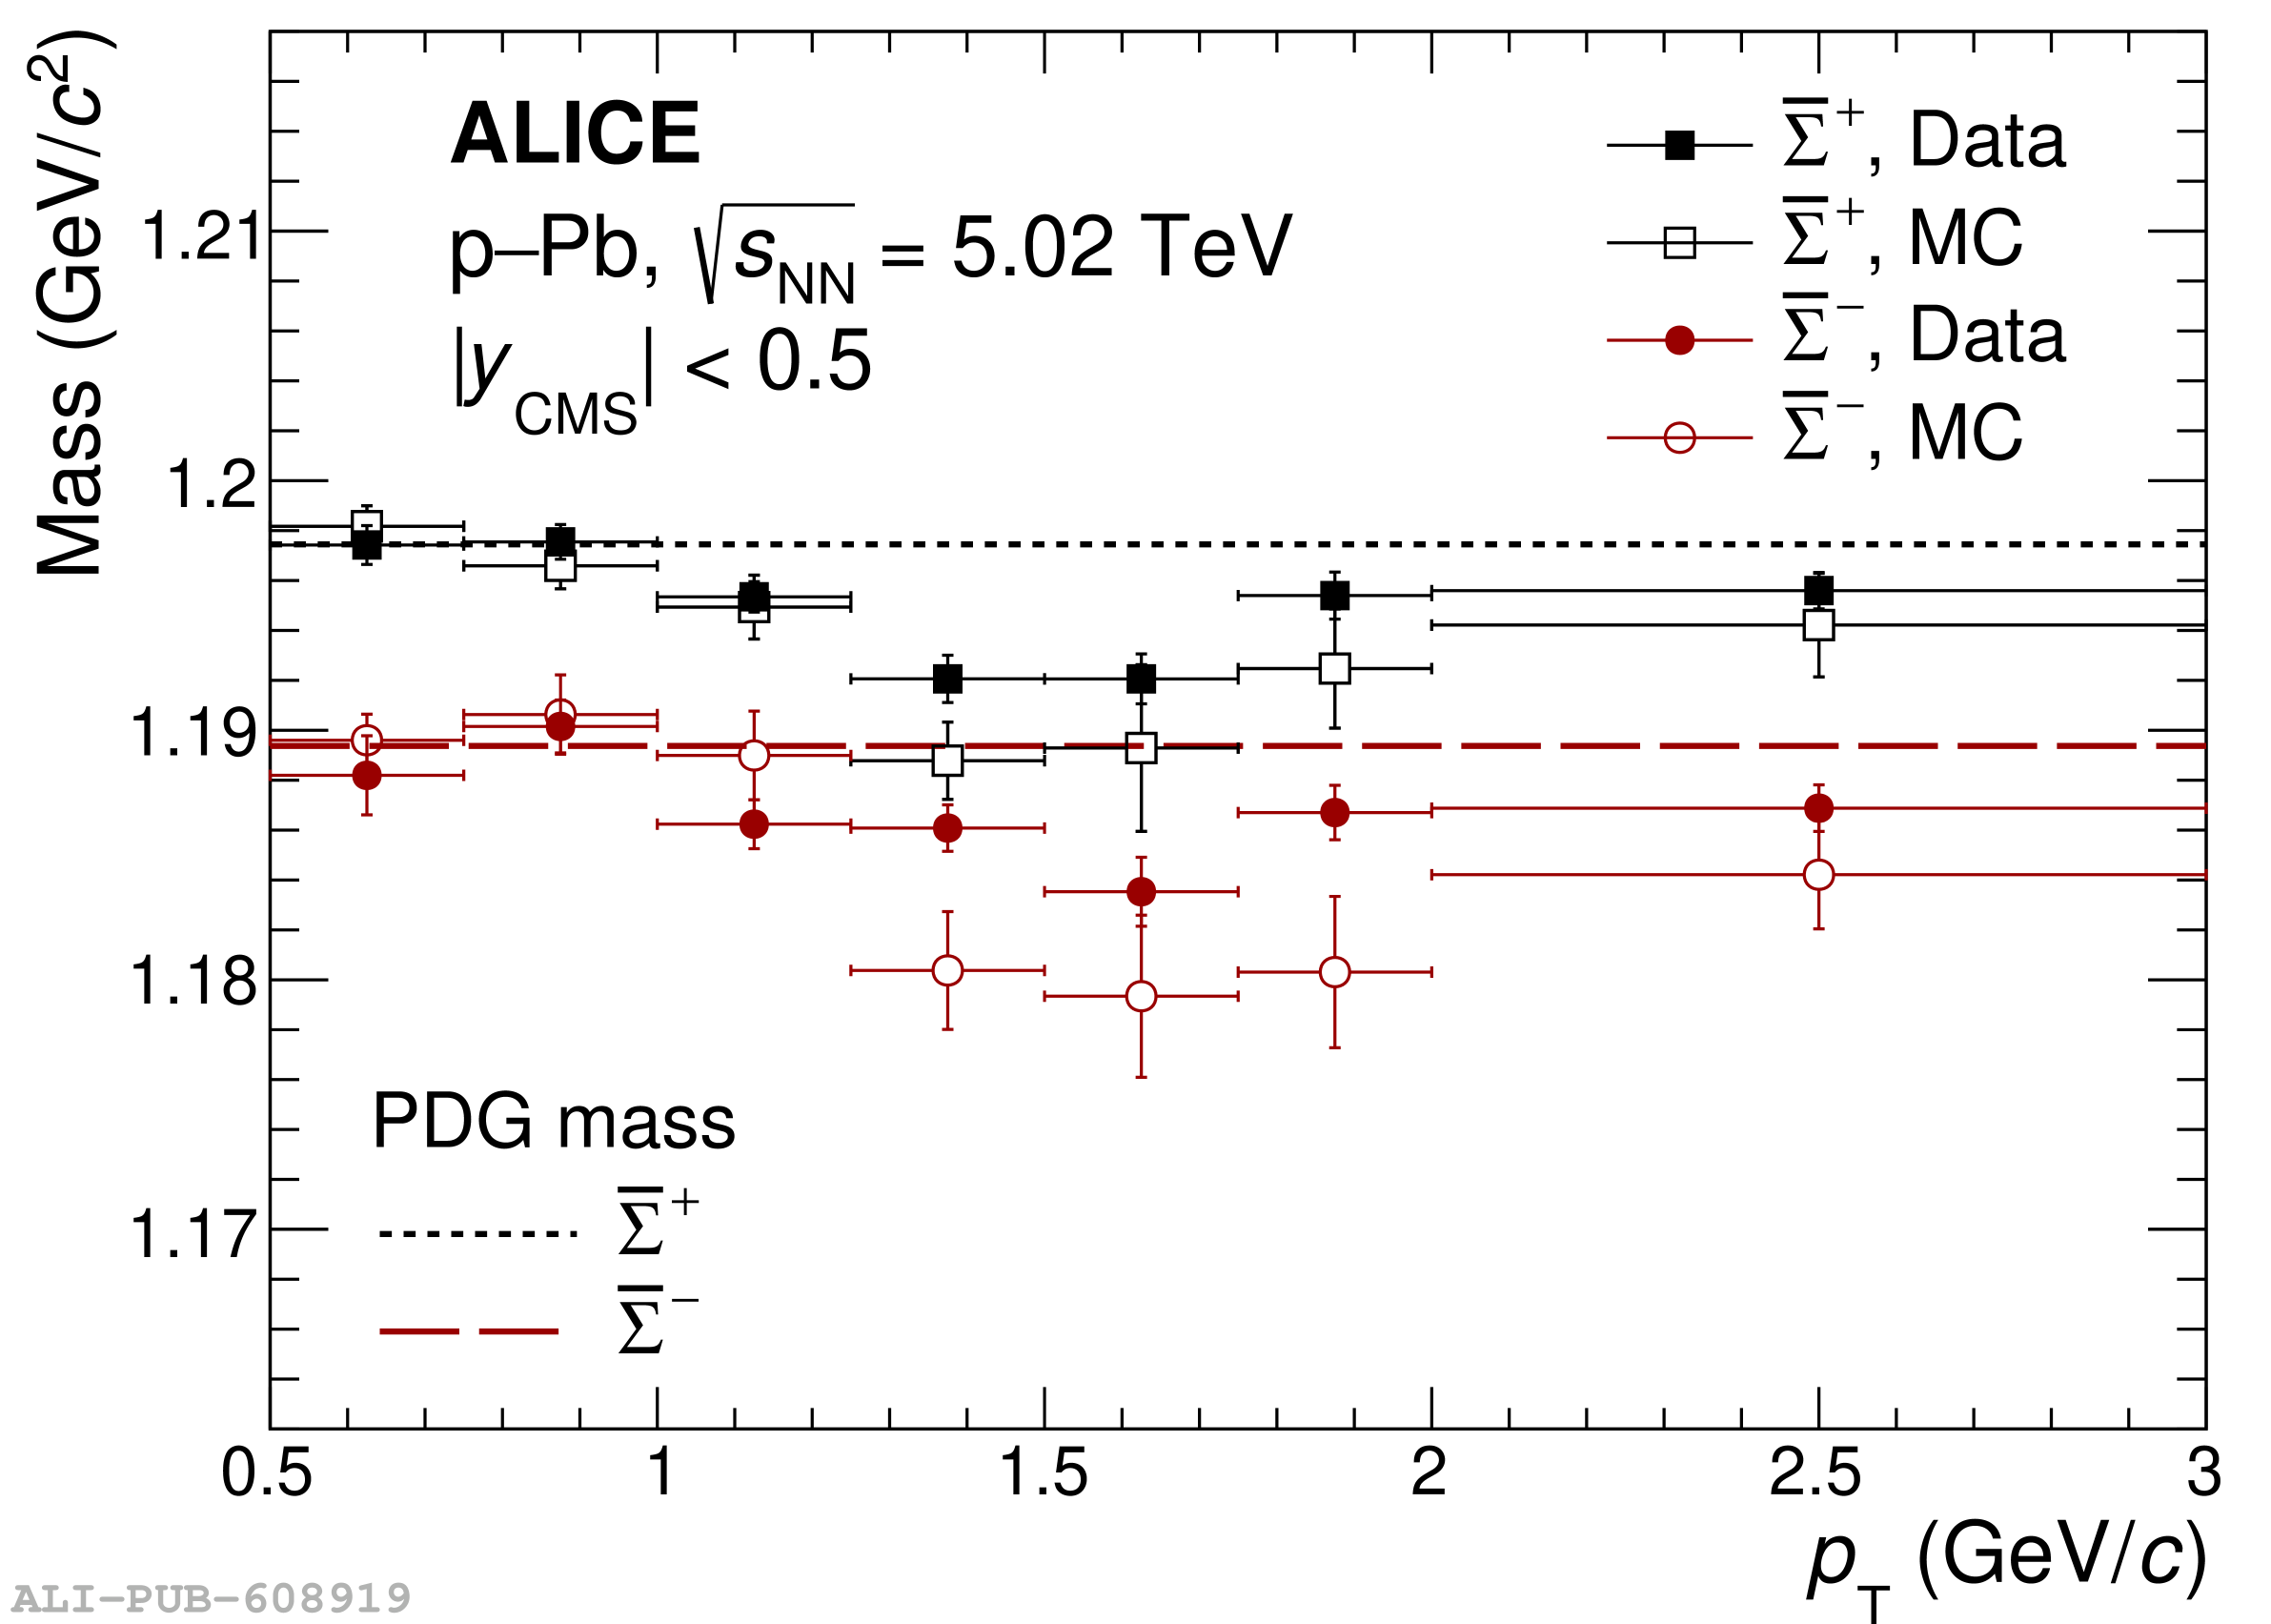  |