1D radii (left) and $\lambda$ parameters (right) as a function of the pair transverse momentum $k_\mathrm{T}$. Statistical uncertainties are shown as bars and systematic uncertainties are depicted as boxes. Points for the 5-10%, 10-20%, 20-30%, 30-40% (50-70%, 70-90%) centrality classes are slightly shifted with respect to the 0-5% (40-50%) centrality class in the $x$ axis direction for clarity. | 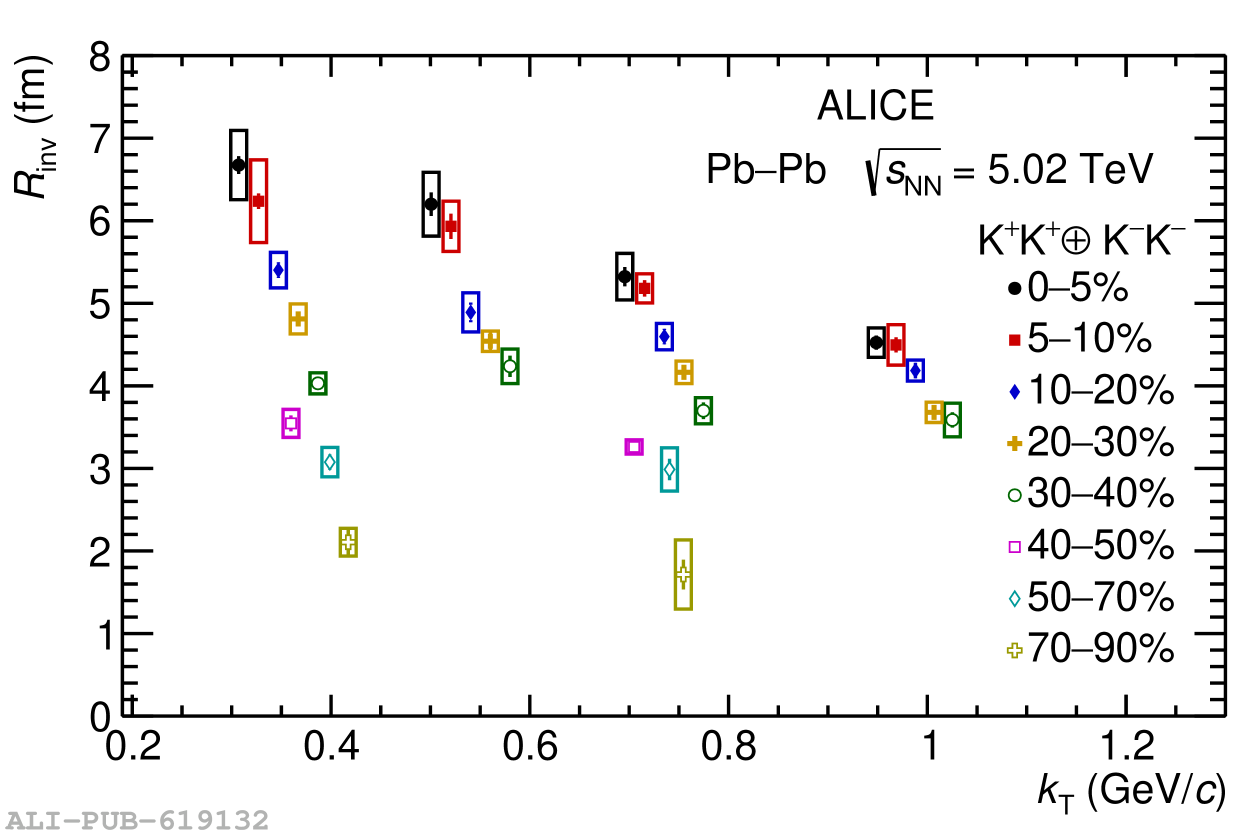 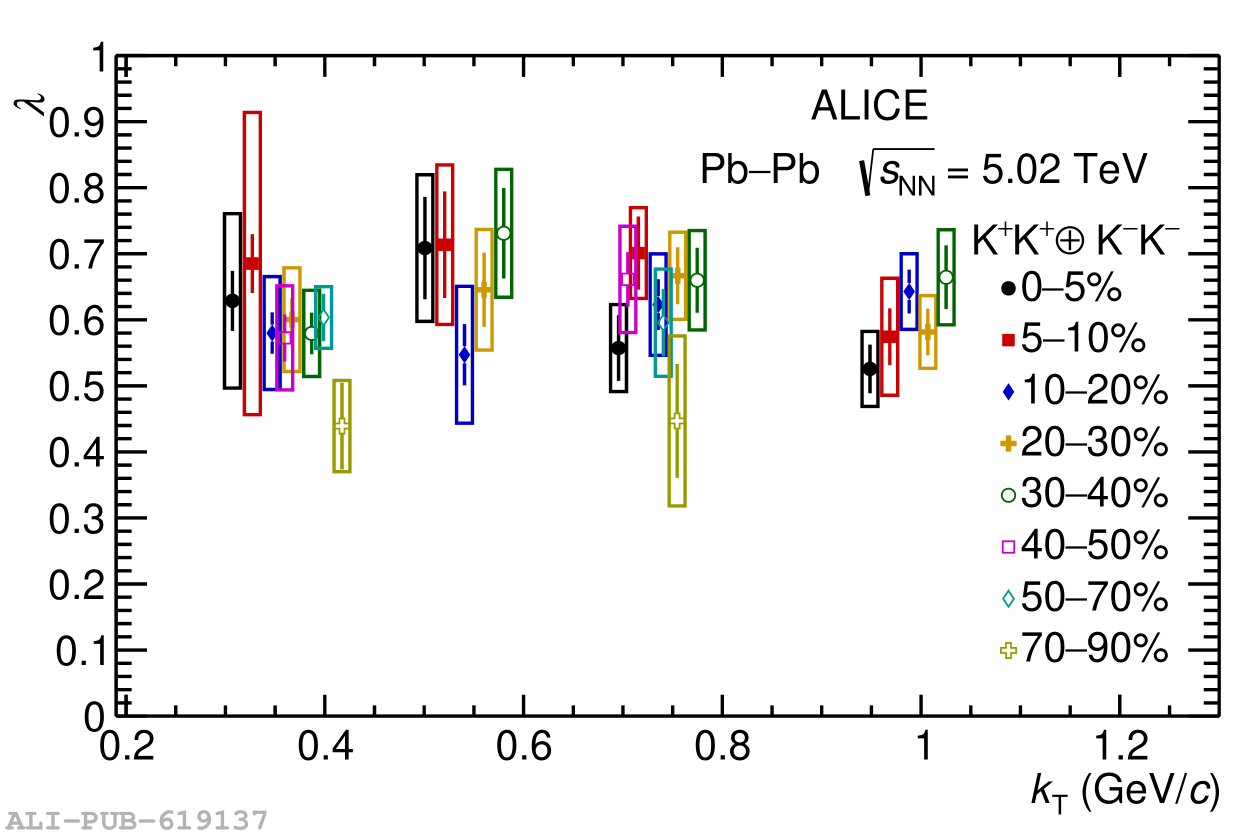 |