3D K$^{\pm}$K$^{\pm}$ correlation functions (black markers) in projections onto the $q_\mathrm{out}$ (left column), $q_\mathrm{side}$ (middle column), and $q_\mathrm{long}$ (right column) axes for four $k_\mathrm{\rm T}$ ranges fitted with Eq.(6) (red lines). To project onto $q_\mathrm{i}$ (i$=$out, side, long) component, the others are integrated over the range $|q_\mathrm{i}| < 0.04$ GeV$/c$ to illustrate the femtoscopic effect for the corresponding axis. Statistical uncertainties are shown by bars, and systematic uncertainties are smaller than the markers. | 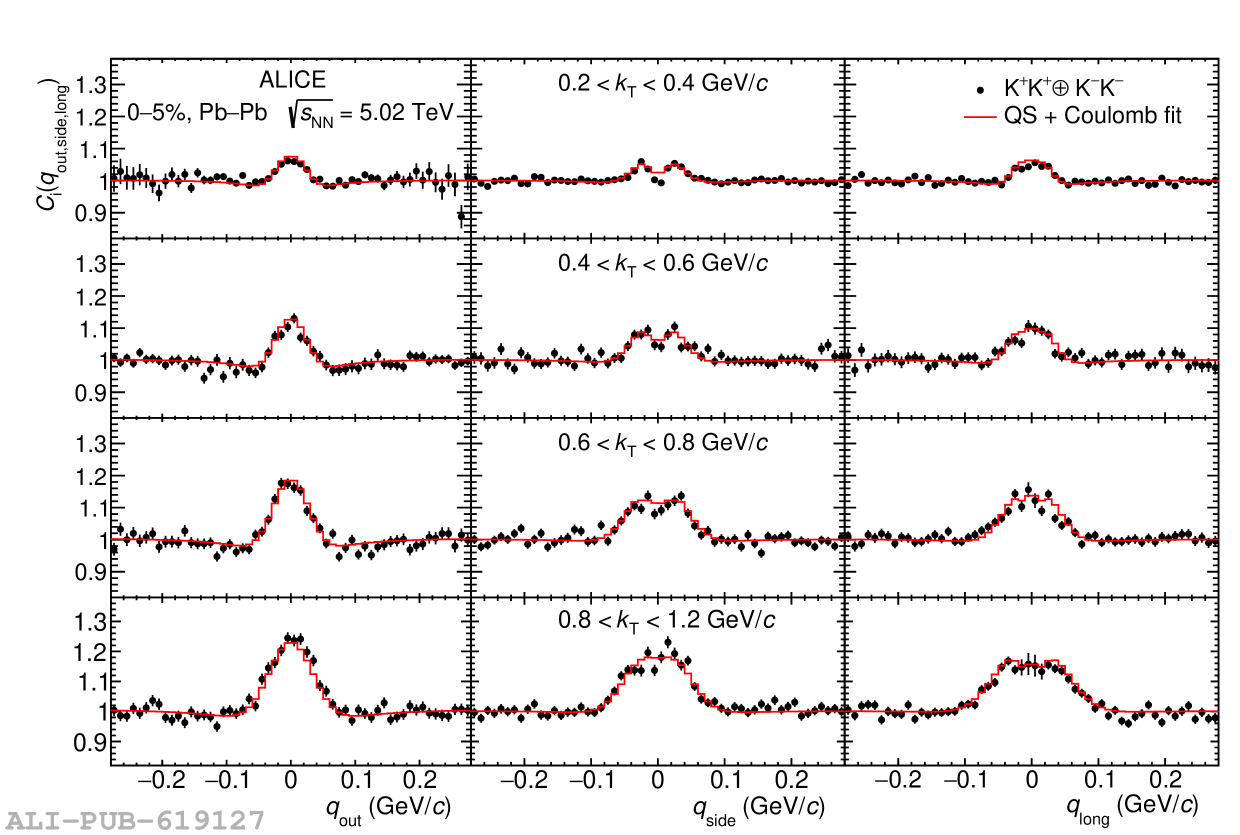 |