Projection of the 3D CF in the ${\rm long}$ direction (black full circles) in three multiplicity classes and two $k_{\rm T}$ ranges fitted (red solid lines) with Eq. (5). Statistical (systematic) uncertainties are shown by bars (boxes). The data are integrated over the range of $|q_i|< 0.15$ GeV$/c$ in the non-projected coordinates. Vertical lines not belonging to any marker at $|q_{\rm long}|\gtrapprox1.0$ GeV$/c$ are very-large error bars of data points that are out of the chosen $Y$ axis range. | 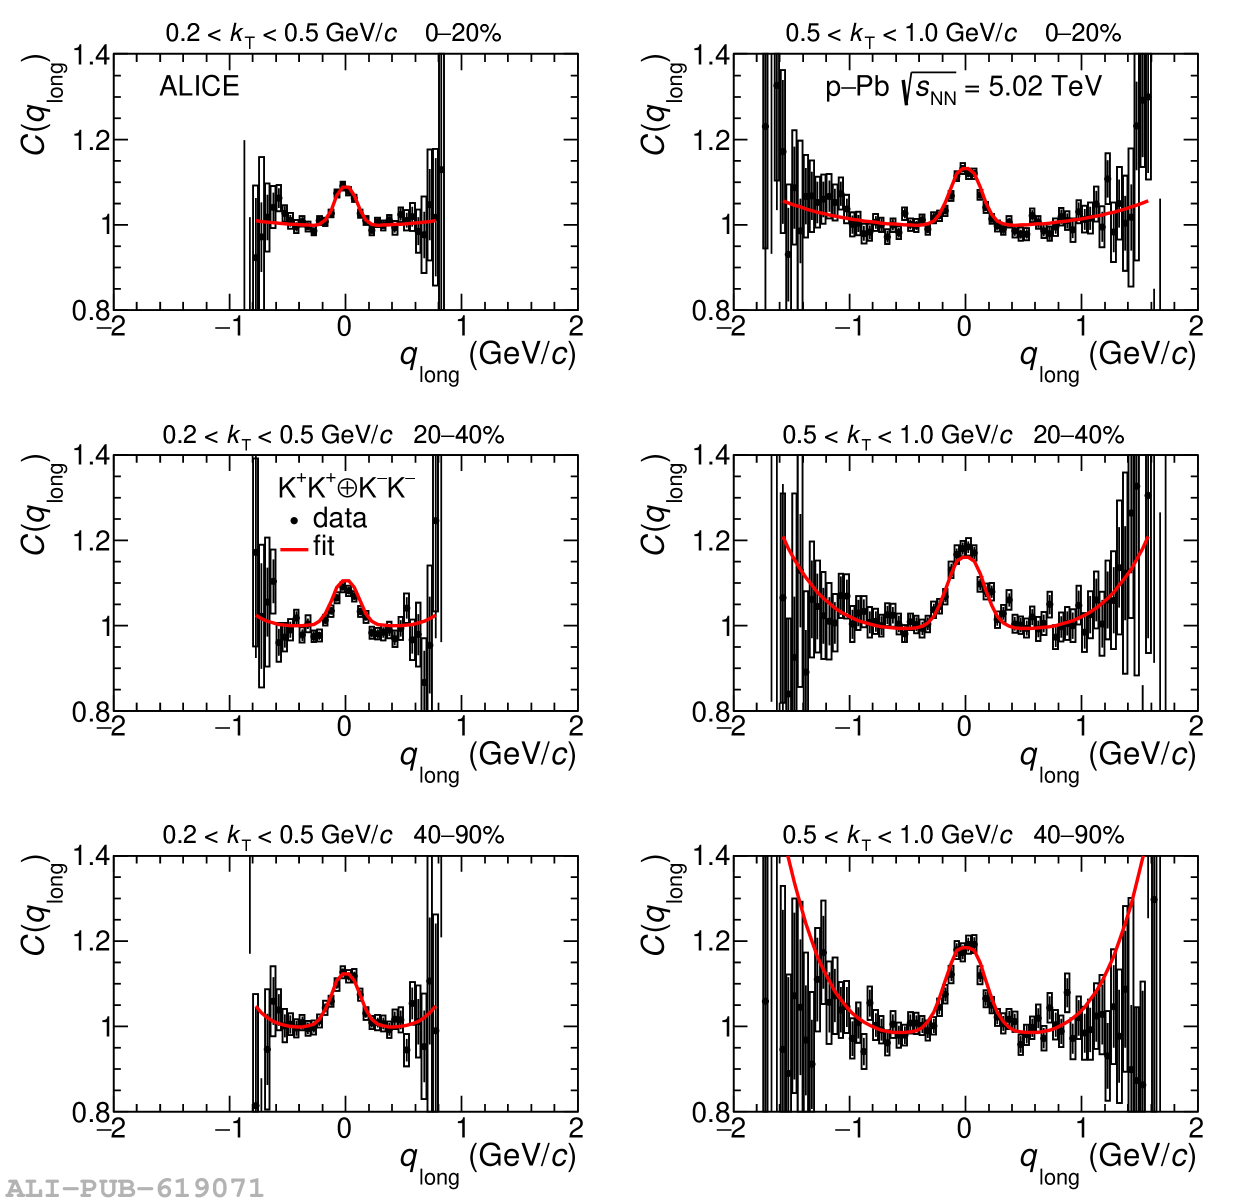 |