Fully unfolded jet axes difference distributions for $\Delta R_{\rm SD-D^0}$ (left) and $\Delta R_{\rm WTA-SD}$ (middle), with grooming parameters $z_{\rm cut}=0.2$ and $\beta=0$, for $10 < p_{\rm T}^{\rm ch jet} < 20$ GeV/$c$. Systematic and statistical uncertainties are represented by color boxes and error bars, respectively, and MC event generator comparisons are shown in the bottom panels. The bottom right panel shows a ratio of the two data distributions. | 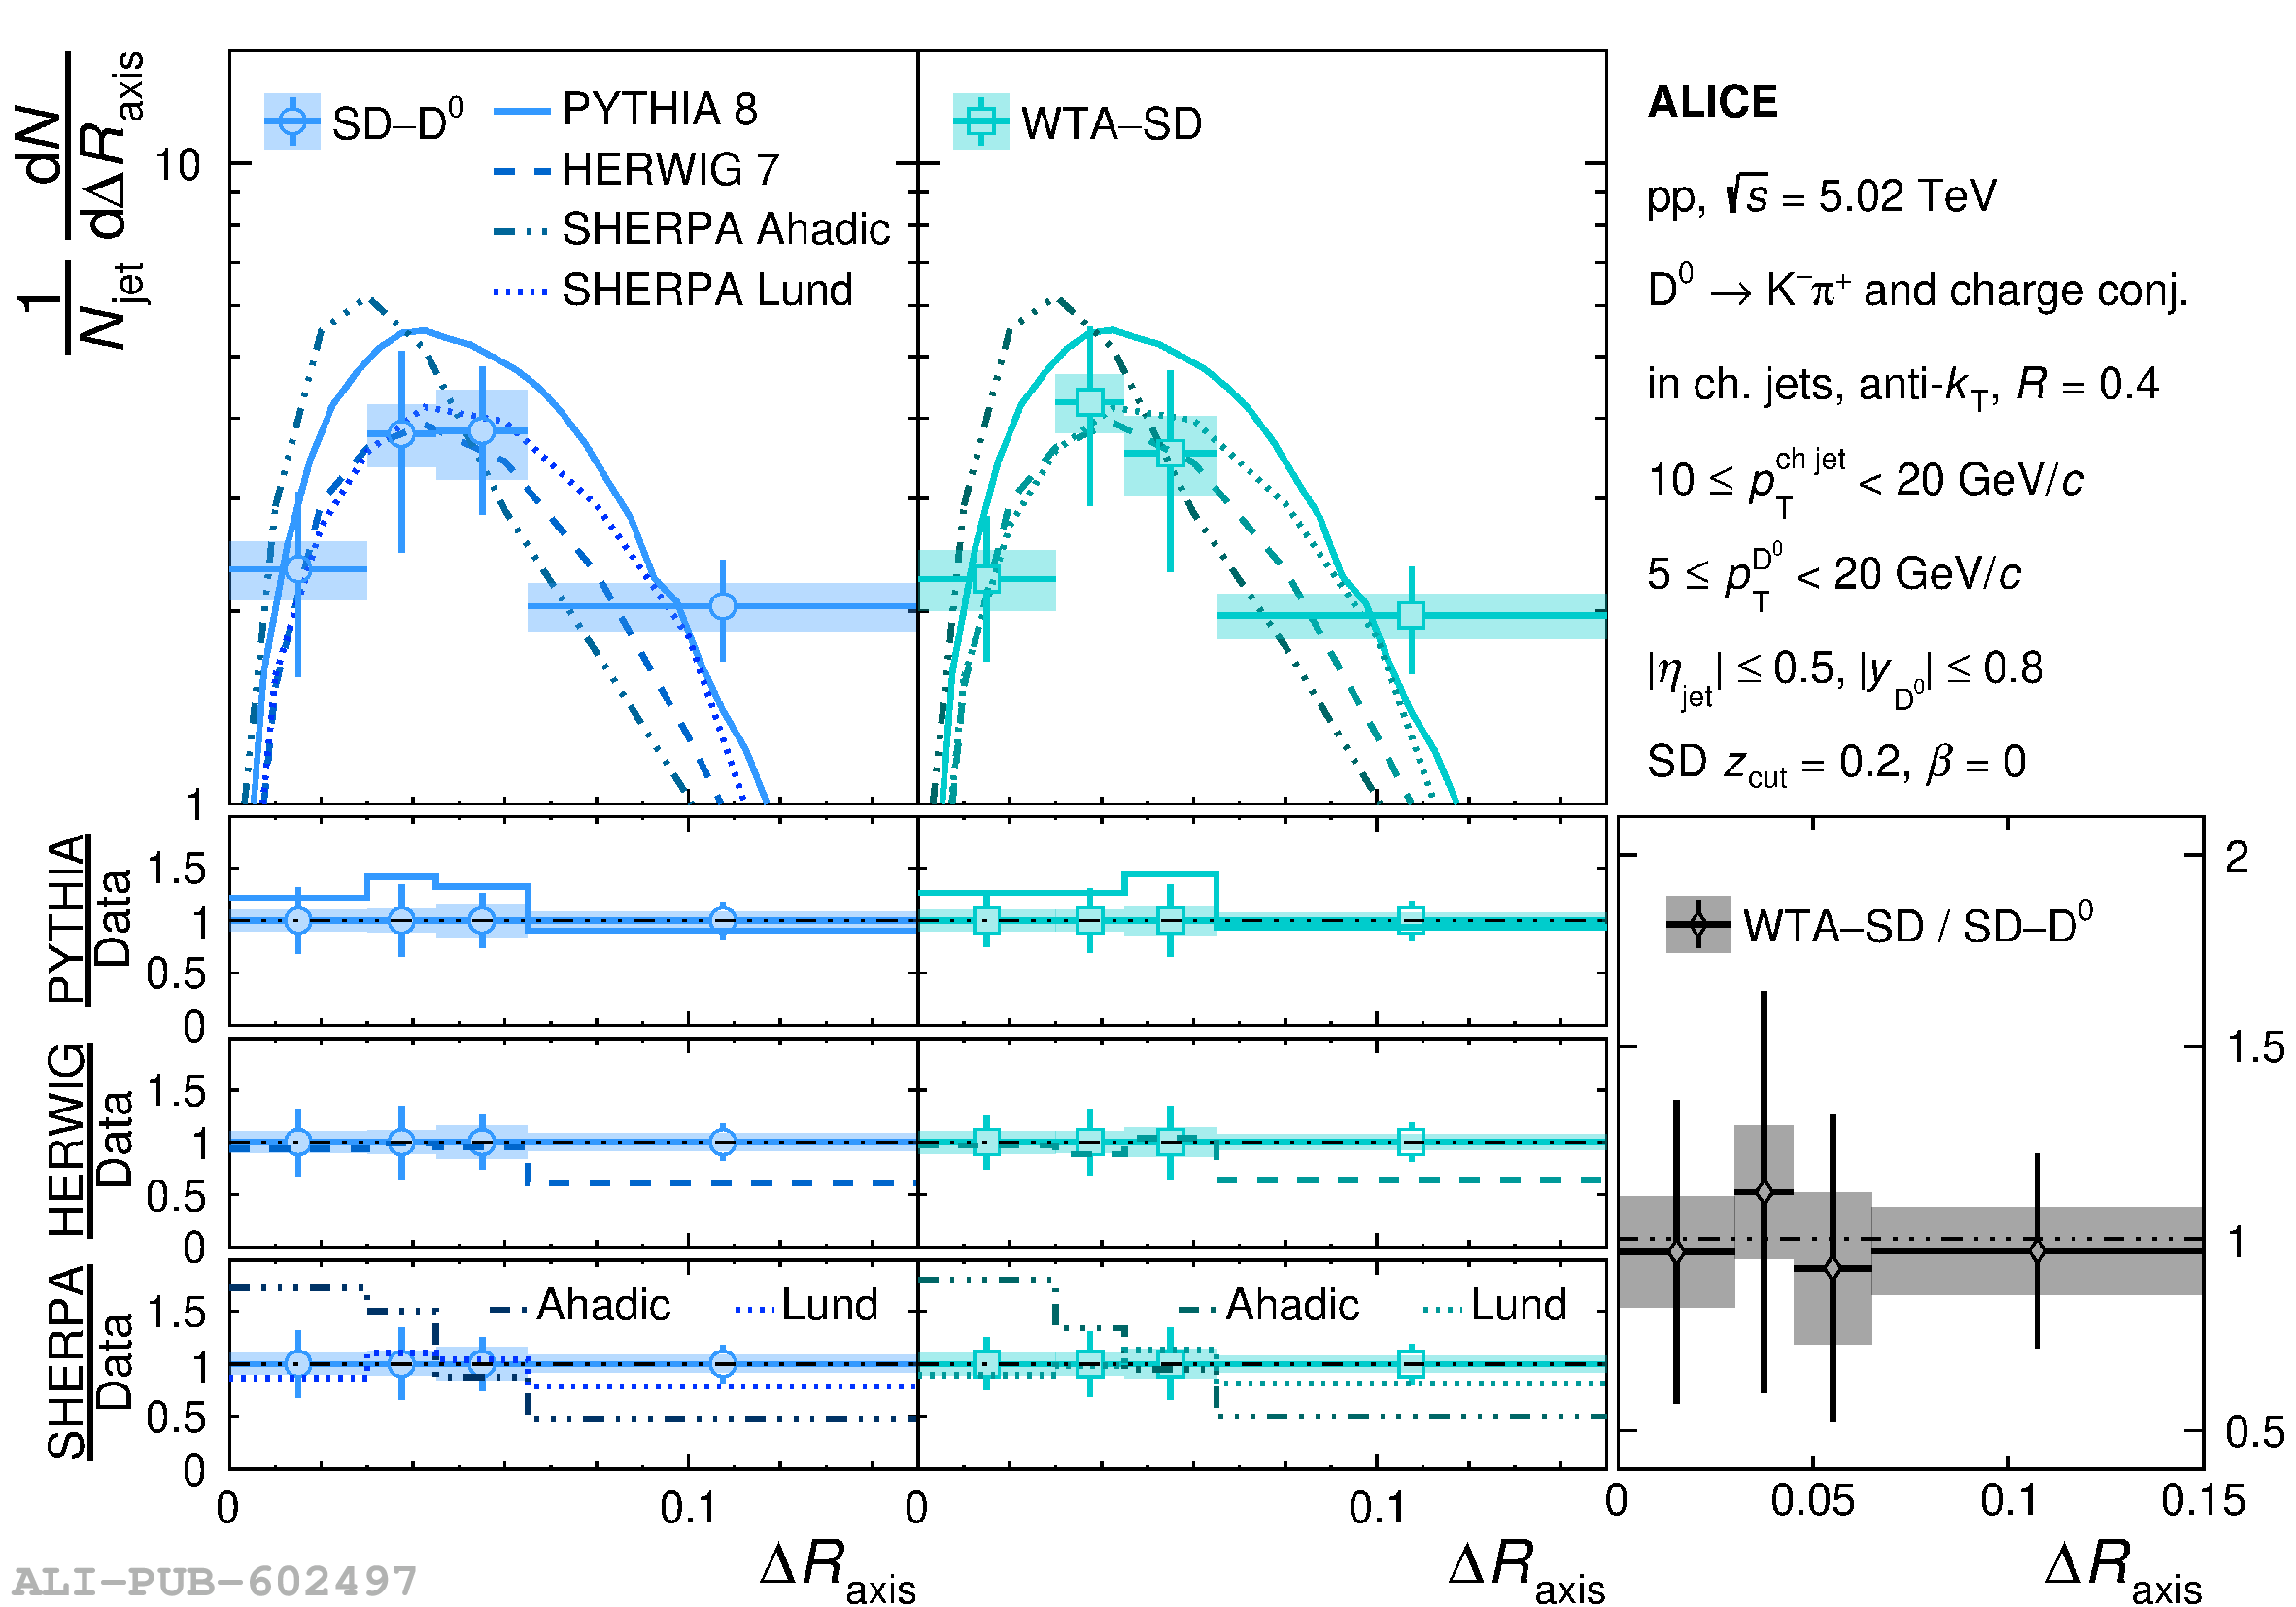 |