Correlation between $p_{\rm T}^{\rm norm}$ and $\langle {\rm d}N/{\rm d}\eta \rangle^{\rm norm}$ in Pb$-$Pb collisions at $\sqrt{s_{\rm NN}}=5.02$ TeV. Each panel shows the results for different centrality estimators defined in Table.1. $p_{\rm T}^{\rm norm}$ and $\langle {\rm d}N/{\rm d}\eta \rangle^{\rm norm}$ are derived from the $p_{\rm T}$ spectra within the 0--10 GeV/$c$ interval for all centrality estimators. For $\eta$-based centrality estimators, the $y$-axis scale should be read from the axis located to the right of the bottom right panel. Lines on top of the data represent fits using Eq.8. The fit range spans from 1 to the last point. Each panel displays the corresponding $c_{s}^2$ values with their total uncertainty, determined by summing the statistical and systematic uncertainties in quadrature. Vertical uncertainty bars in each point represent the combined statistical and systematic uncertainty. The total uncertainty in the $\langle {\rm d}N/{\rm d}\eta \rangle^{\rm norm}$ is negligible and therefore not visible. | 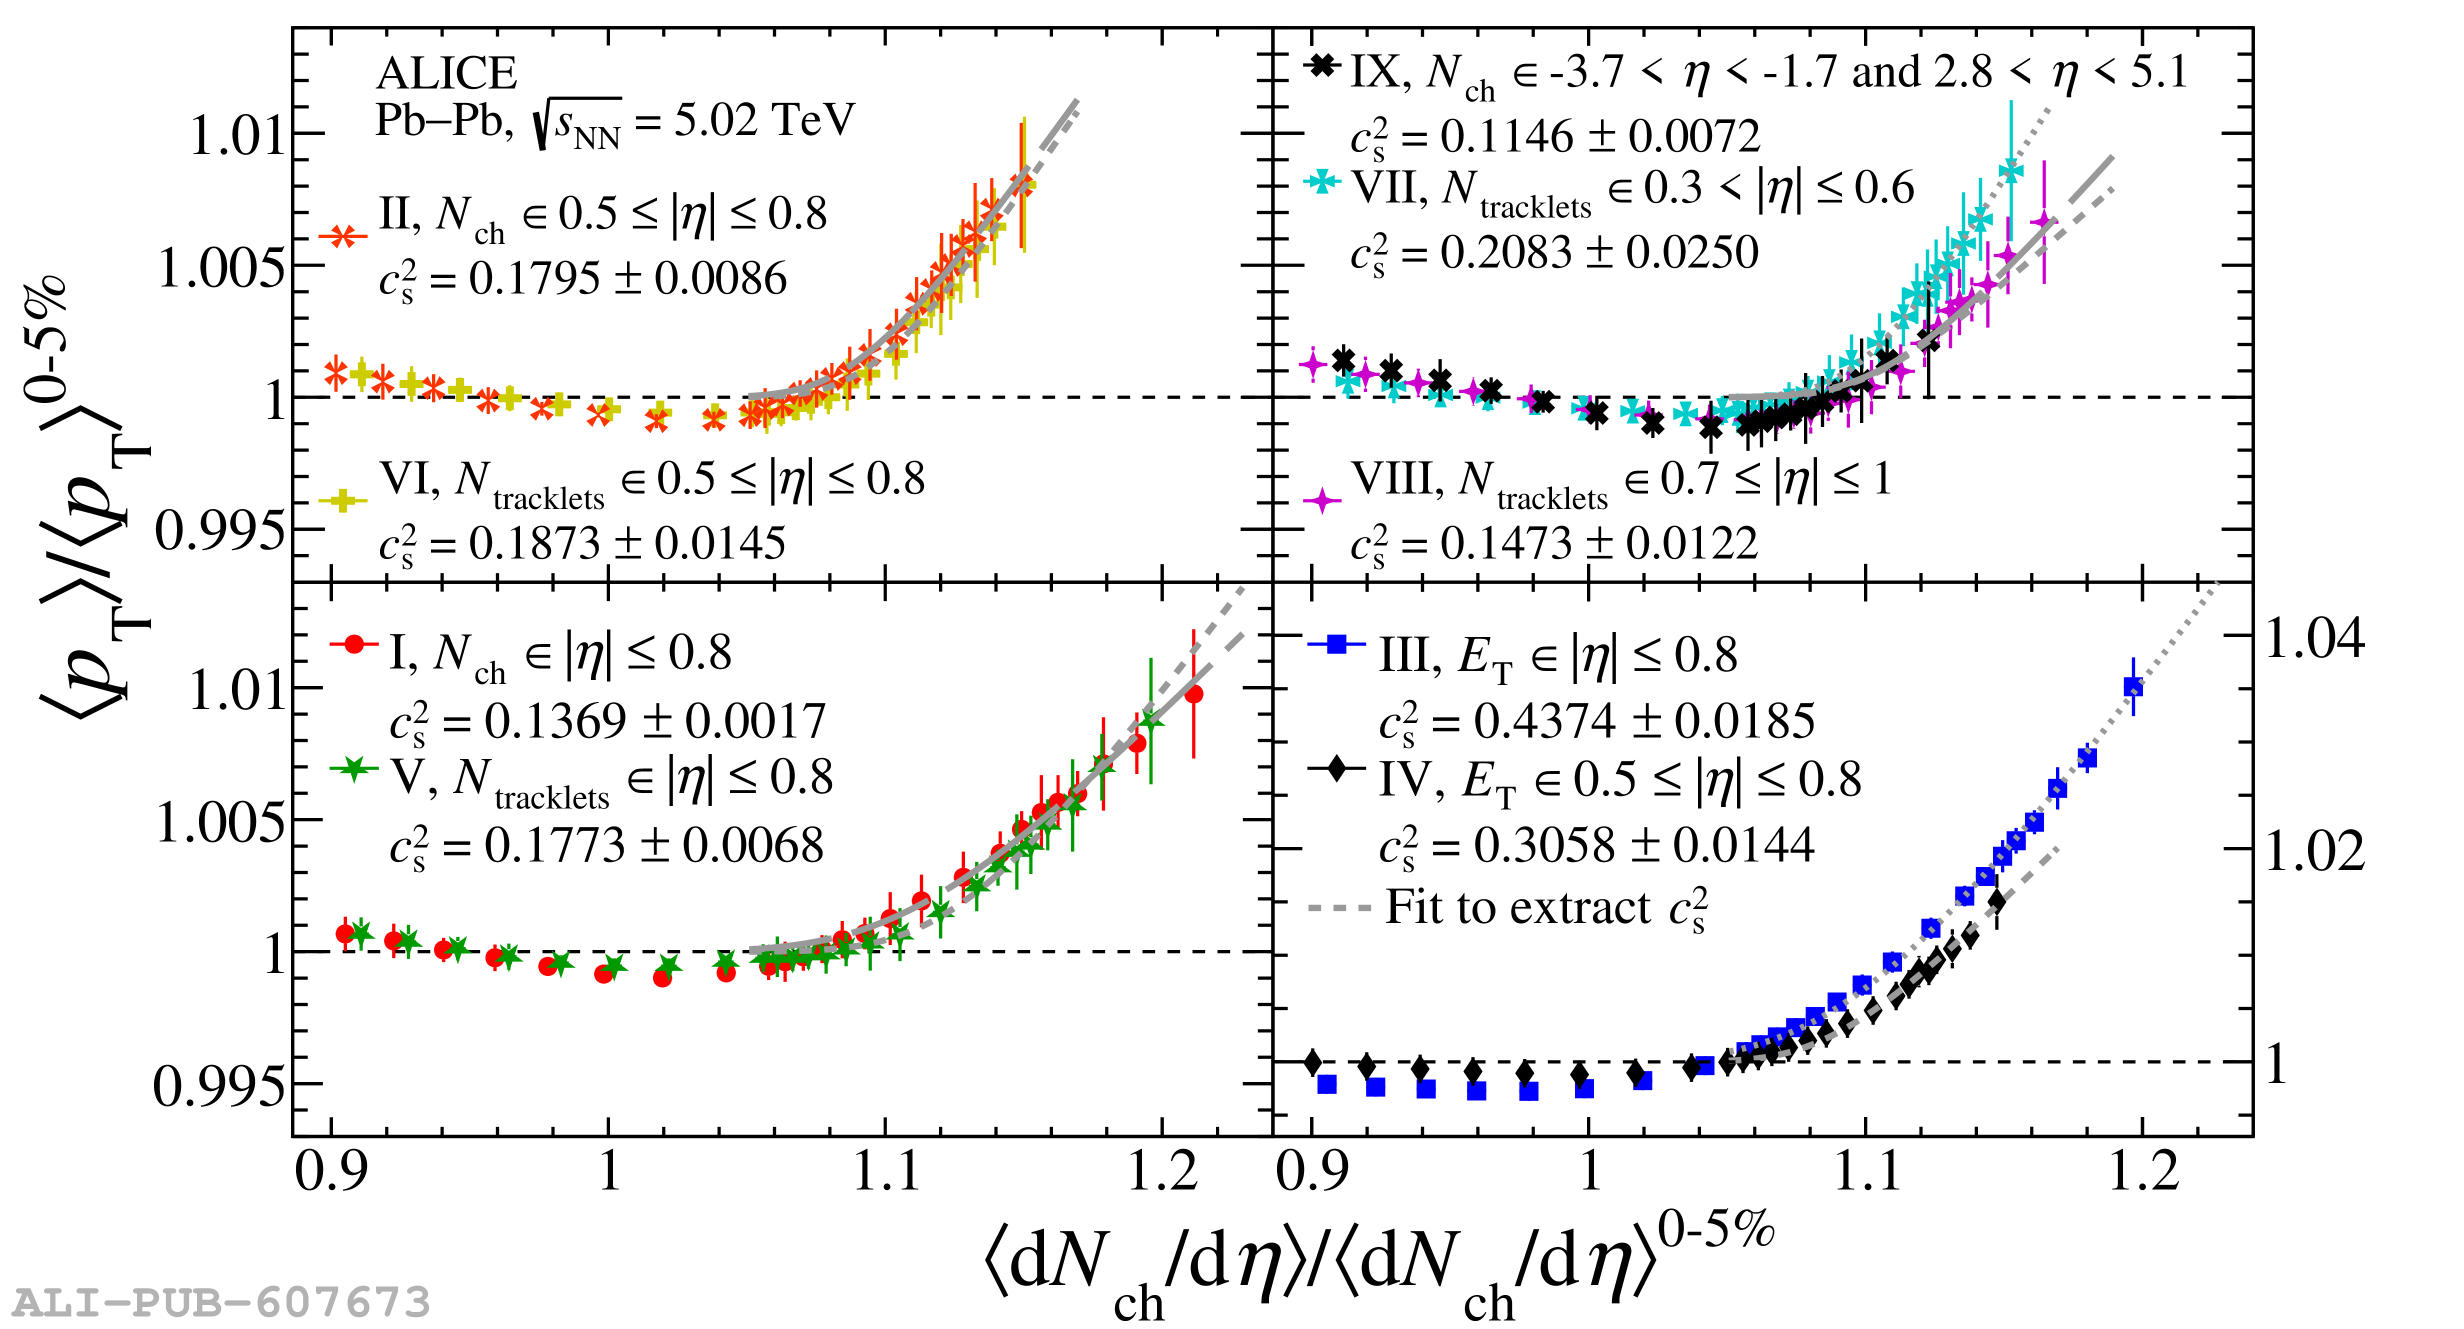 |