(left) $\eta/\pi^0$ ratio for a low and high multiplicity interval, together with the inclusive $\eta/\pi^0$ ratio. Predictions from EPOS LHC and PYTHIA8 Ropes are also shown. The lower panel displays the ratio of the $\eta/\pi^0$ ratio in each multiplicity interval to the inclusive $\eta/\pi^0$ ratio. (right) Mean values of the $\eta/\pi^0$ double ratios as a function of the normalized charged-particle multiplicity for two $p_{\rm T}$ intervals. The depicted model predictions are shown as lines with bands representing the minimum and maximum values of the double ratio from the left panel in the given $p_{\rm T}$ interval. |  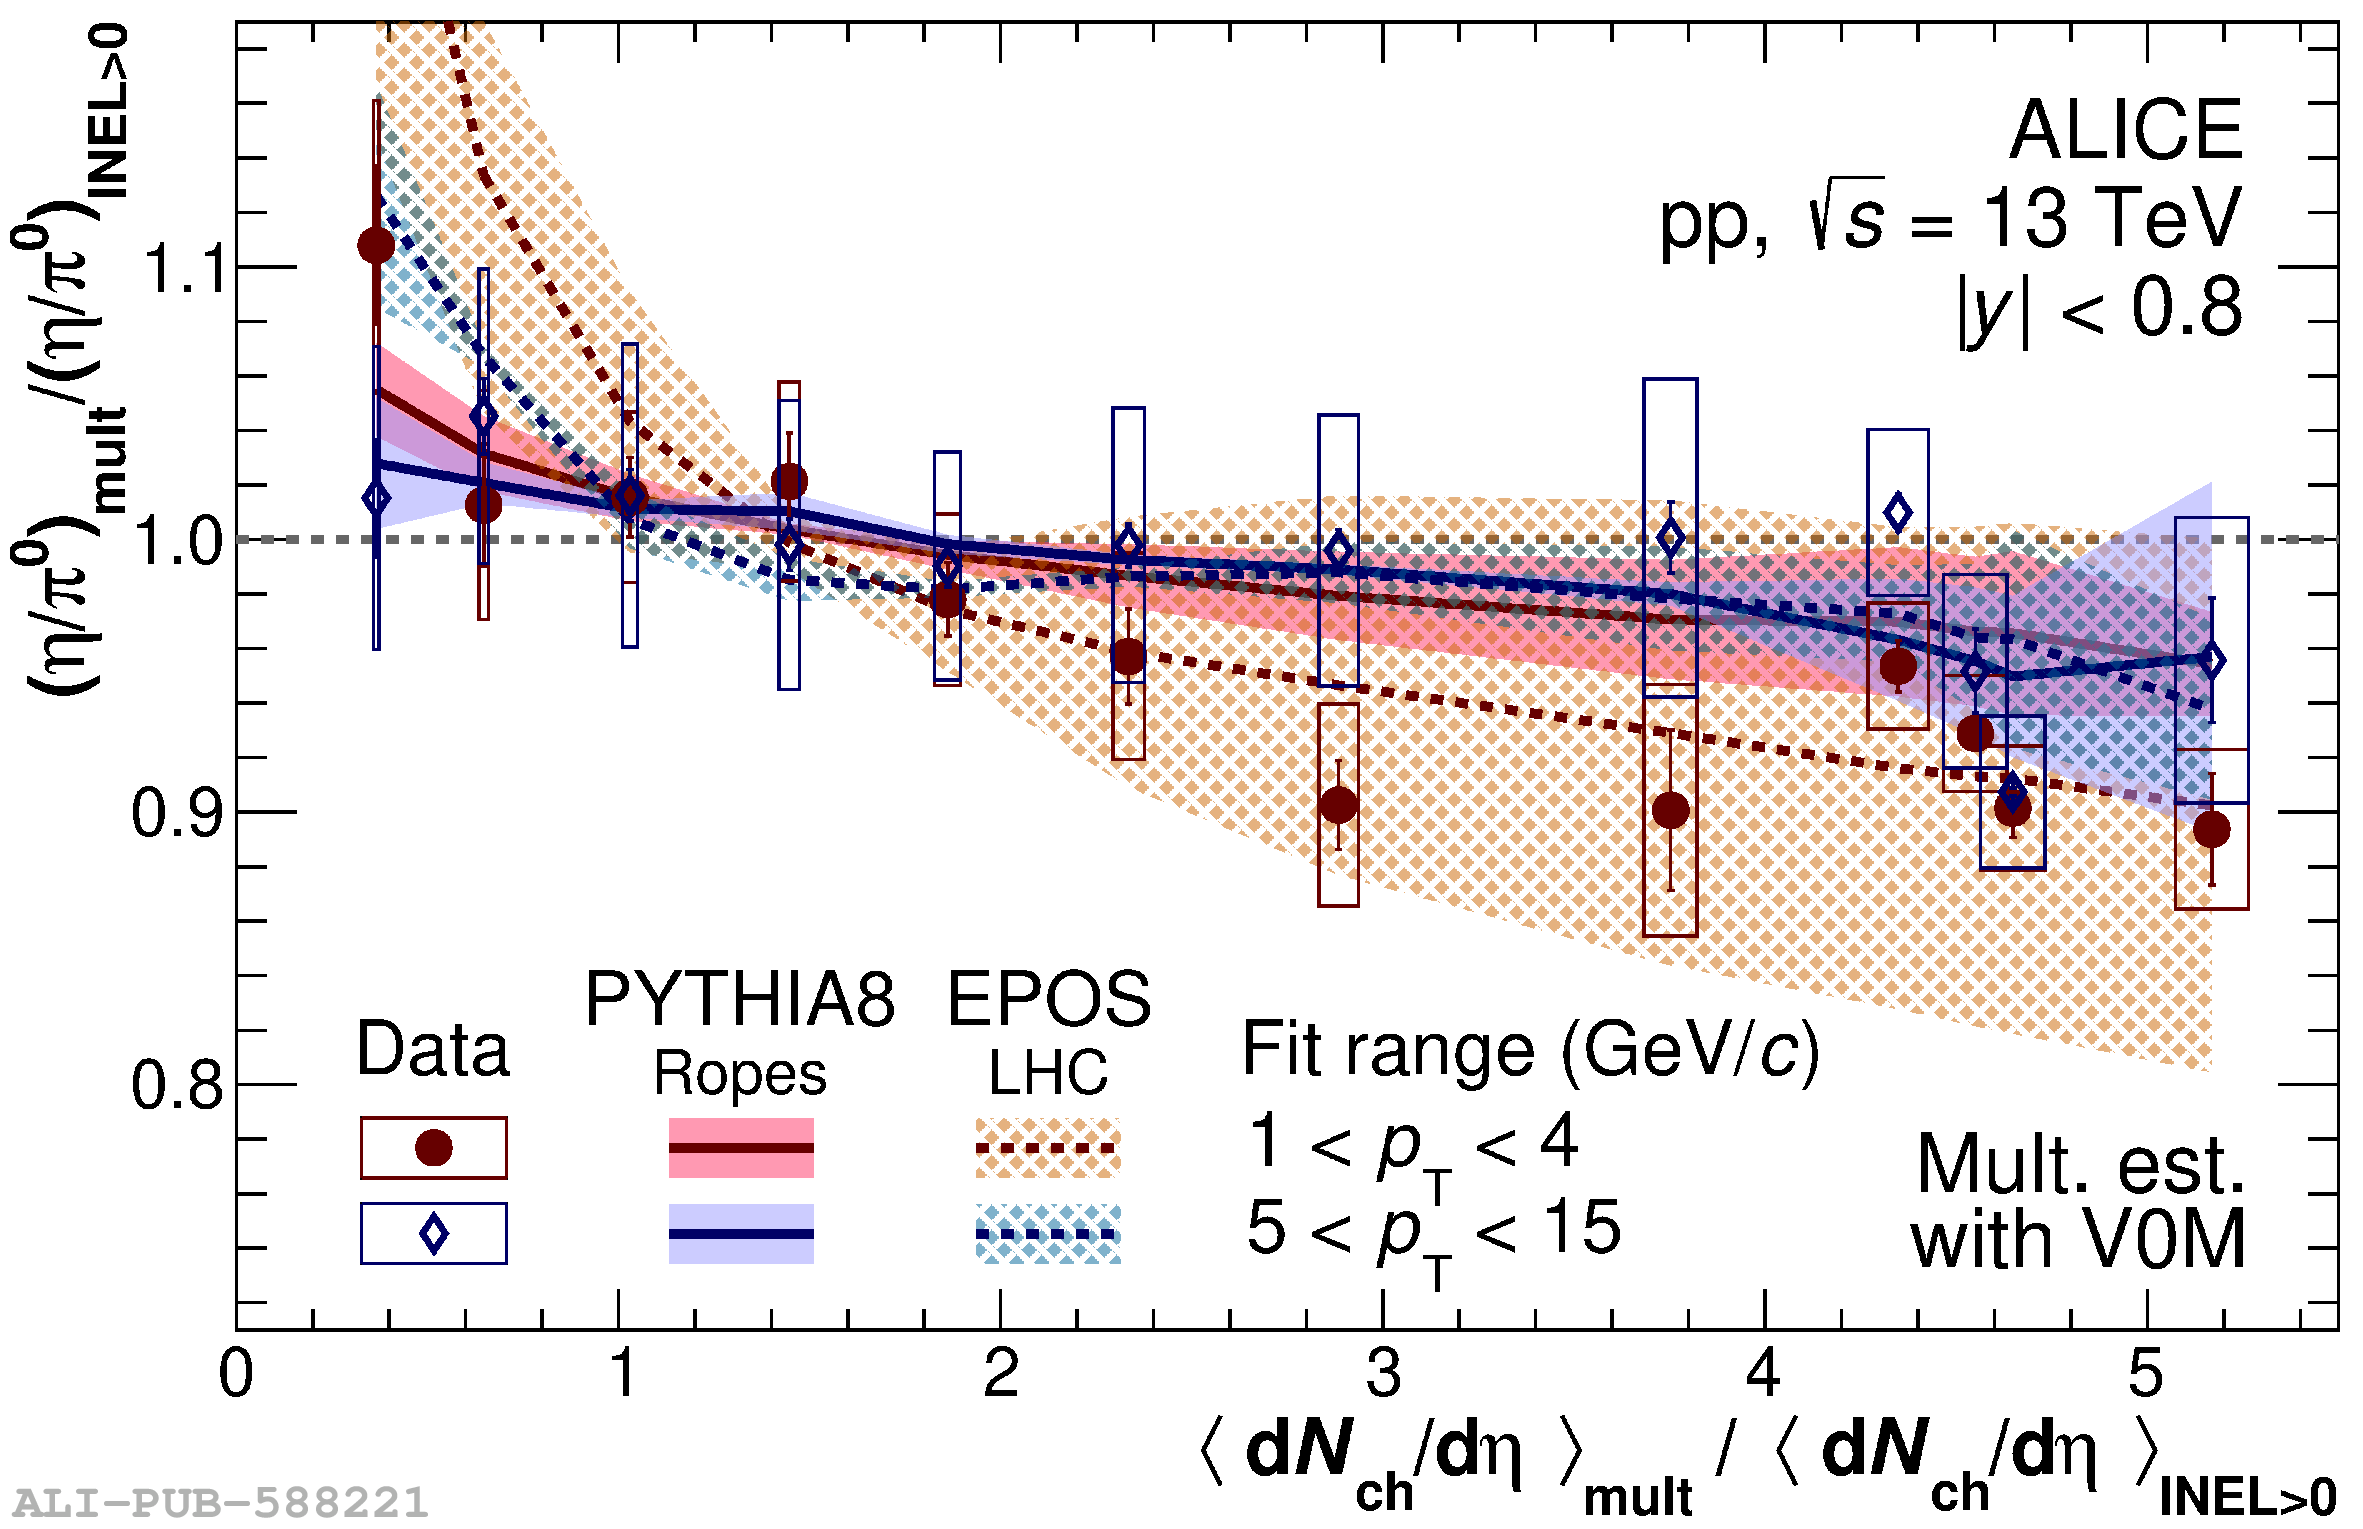 |